
US & UK sector rotations
In April, US cyclicals underperformed growth stocks, indicating a sector rotation out of cyclicals. This sector rotation is linked to US economic growth forecasts. But is there still value to be generated from UK cyclicals?
The rotation out of cyclicals in the US and into growth stocks and other hyper growth instruments in the US and the UK seems to have caused general concern from central banks – the US Federal Reserve recently warned that valuations are looking stretched, for growth stocks in particular.
Our technical investment research team at ACF suspects enough retail money is finding its way into cryptos and other non-fungible tokens (NFTs) to soften equity values in the UK. The UK’s Bank of England (BoE) is sufficiently concerned about cryptos and NFTs that it has recently warned that investors should prepare themselves to lose their shirts.
Key Points:
- There are early signs that the rotation into small and mid-cap cyclical stocks is now in reverse in the US.
- Goldman Sachs expects US economic growth to peak in 2Q21 at 10.5% supporting the growing, consensus opinion that the valuation uplift driven by expectations of the reopening of trade post covid, may soon peak – bad for cyclicals.
- Barclays Bank in the UK recently stated that it expects the UK to experience a significant economic expansion in 2H21 due to corporate and retail cash balances, far lower than expected debt defaults and the success of the UK’s vaccine rollout – but 2H21 may represent peak GDP growth for a while.
- There could still be more gains from cyclical stocks in the UK (see exhibit 4 below), but data is beginning to show that investors are rotating portfolios out of companies that benefit from a surging economy (cyclicals) and into ones that perform well under broader business cycle conditions (defensive/growth). As capital markets are a forecasting mechanism, the guidance from Goldman’s and Barclays may well already be in the price of most cyclical stocks.
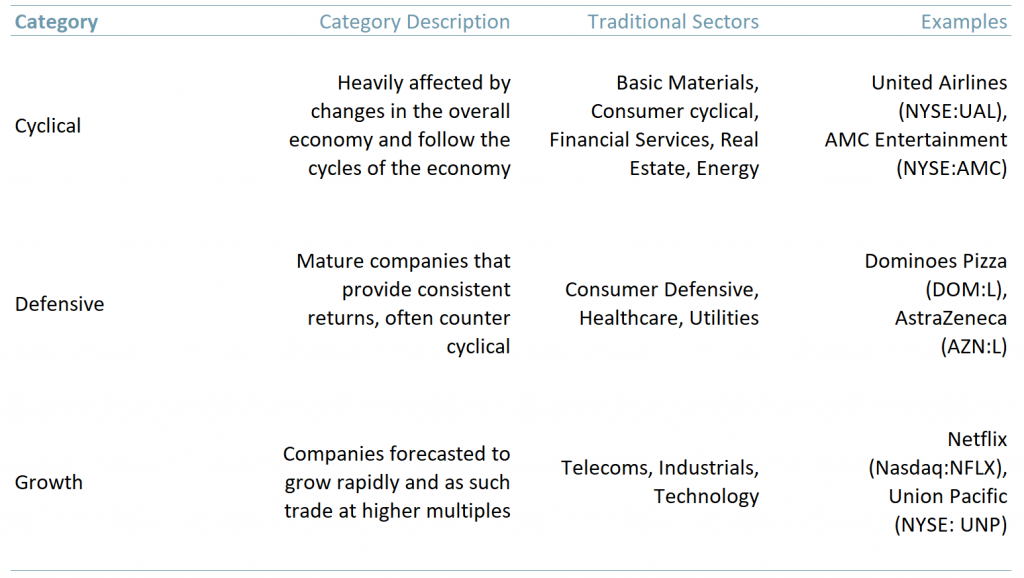
In general, there are five main categories of stocks: cyclical, growth, defensive, income/dividend and value. A company can be in one or more of these categories and it will inevitably change classification over time.
Cyclical stocks rise and fall with the real economy. Value stocks are companies that are generally thought to be undervalued – the net asset value per share (NAVPS) is often higher than the price the company trades at. Income/dividend stocks are well established companies that pay out regular dividends, popular with institutional investors. For the purpose of this analytical blog, the emphasis is on cyclical stocks in particular (exhibit 1).
Exhibit 1 – Cyclical, defensive and growth stock categories, and their traditional sectors
 Source: ACF Equity Research Graphics
Knowing how stocks perform in relation to the economy represents an opportunity. A simple strategy would be to weight a portfolio with different categories of stock (as per exhibit 1) in line with the health of the economy and then change that weighting as the economy goes through its cycle, i.e., rotate in and out of sectors.
There are four main commonly recognised stages in an economic cycle:
- Early recession – Consumer spending is falling with industrial output as interest rates reach their highest point. Utilities (Defensive) stocks perform well in this period.
- Full recession – GDP, interest rates, consumer spending and industrial output are all falling and unemployment typically is rising. Tech (growth) stocks often perform well in this period.
- Early recovery – Consumer spending and industrial output is increasing as interest rates have bottomed and the unemployment rate begins to fall. Industrials, basic materials, and energy producers (Cyclical) stocks perform well in this period.
- Late recovery – Interest rates may be rapidly rising in response to accelerating inflation. Unemployment rate, consumer spending and industrial output have flattened out. Consumer staples (Cyclical) stocks perform well in this period.
On 19th Feb 2020, Covid-19 became a household name as infection numbers rose in Italy and across Europe. Cyclicals were most affected by national lockdowns and underperformed the rest of the market in 2Q20 and 3Q20. This was the ‘full recession’ period where technology (growth) stocks outperformed the rest of the market.
From 2nd Nov 2020, markets began to rise in expectation of positive vaccine results. This was confirmed On 9th Nov 2020, when Pfizer (NYSE: $PFE) and BioNtech (NASDAQ: $BNTX , $22UA.F) announced that their vaccine tests had successfully prevented Covid-19 infections. The successful vaccine news accelerated the rotation into cyclicals that had started at the beginning of the month.
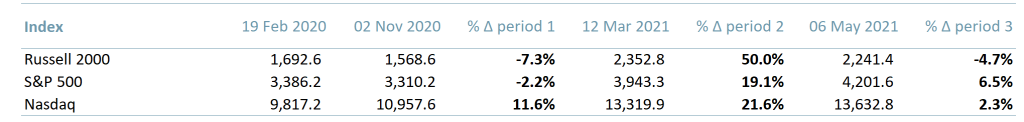
Between 2nd Nov 2020 and 12th Mar 2021, cyclical stocks outperformed the rest of the market. The Russell 2000 increased by 50.0%, outperforming the Nasdaq showing a 21.6% increase (exhibit 2). We estimate that on 12th Mar 2021 there was a rotation out of cyclicals as consensus began to grow that US economic growth will peak in 2Q21 and hence the economic cycle is on track to enter something approaching the ‘late recovery‘ phase.
Exhibit 2 below shows a table of US indices levels at the start of the pandemic (19th Feb 2020), just prior to the Pfizer and BioNtech vaccine results (2nd Nov 2020), mid-March (12th Mar 2021) and on 6th May 2021.
This table shows how small cap cyclical stocks (Russell 2000, $RUT) have outperformed larger cap growth stocks (S&P, Nasdaq) between the 2nd Nov 2020 and 12th Mar 2021 (period 2) but underperformed Mar-May (period 3). This supports the idea of a sector rotation in the US out of cyclicals and into growth stocks.
Exhibit 2 – Table showing the performance of US indices 19/02/2020 – 06/05/2021
 Sources: ACF Equity Research Graphics; Yahoo Finance.
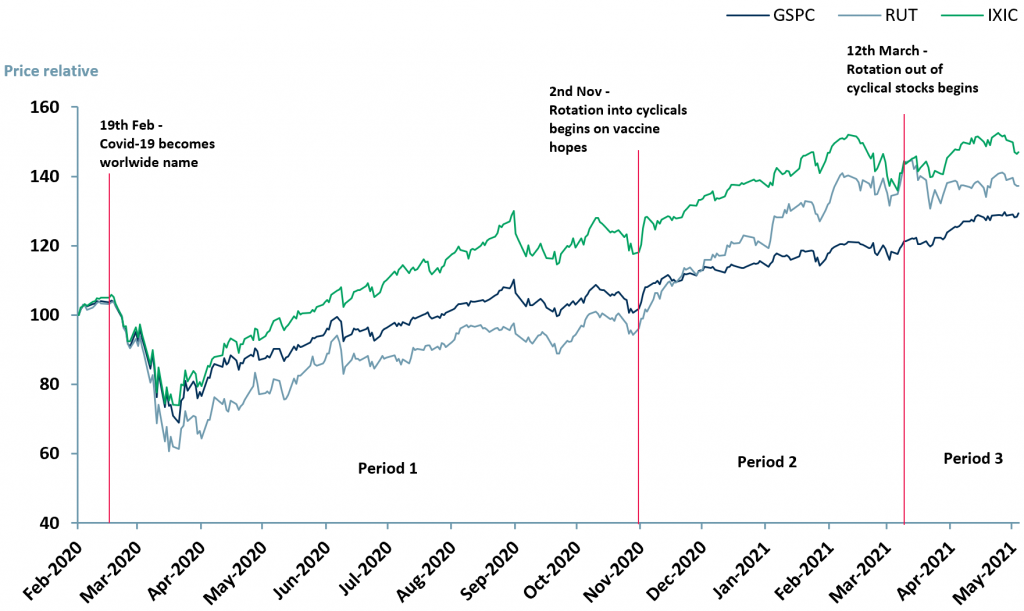
Exhibit 3 shows a price relative chart of three US indices, Nasdaq, S&P 500 and Russell 2000. Period 1 shows that the Nasdaq (green) outperformed the Russell 2000 (light blue) and the S&P 500 (dark blue). In period 2, the Russell 2000 outperformed both the S&P 500 and Nasdaq until 12th Mar 2021, when the rotation out of cyclicals began and the Russell 2000 underperformed both the Nasdaq and S&P 500.
Exhibit 3 – Price relative performance of the S&P 500 (GSPC), Russell 2000 (RUT) and Nasdaq (IXIC) 03/02/2021 – 23/05/2021
 Sources: ACF Equity Research Graphics; Yahoo Finance
This sector rotation is more challenging to see using price relative analysis within UK indices. Both the FTSE 100 and FTSE 250 are made up mostly of cyclical stocks. However, an alternate way to assess the UK stock rotation is to look at the sector weightings of the FTSE 100 and the relative performance at certain points in 2020 (exhibit 4).
Exhibit 4 – Cyclical weighting and performance of the FTSE 100 31st Dec 2019 – 30th Apr 2020
 Sources: ACF Equity Research Graphics; Yahoo Finance
Exhibit 4 shows a clear rotation out of cyclicals between 31st Dec 2019 and 30th Jun 2020 (see weighting and drop in index value). A clear rotation back into cyclicals is shown in exhibit 4 between 31st Dec 2020 and 30th Apr 2021. The FTSE 100 index is currently trading around 7,100 still some 450 points or ~6% below its 31st Dec 2019 high but the weighting of cyclicals in the index has returned to YE19 levels, suggesting that the cyclical sector remains attractive from a returns perspective.
The returns to be had in FTSE 100 cyclicals are perhaps in the order of 6% – or perhaps more, due to the expansion in commodity prices.
As the US economy seems to be ahead of the UK, we expect rotation out of cyclicals to complete in the US but the rotation into cyclicals to continue in the UK.
Author: Sam Butcher – Sam is a Junior Staff Analyst at ACF Equity Research. See Sam’s profile here


