
ACF Outlook 2024
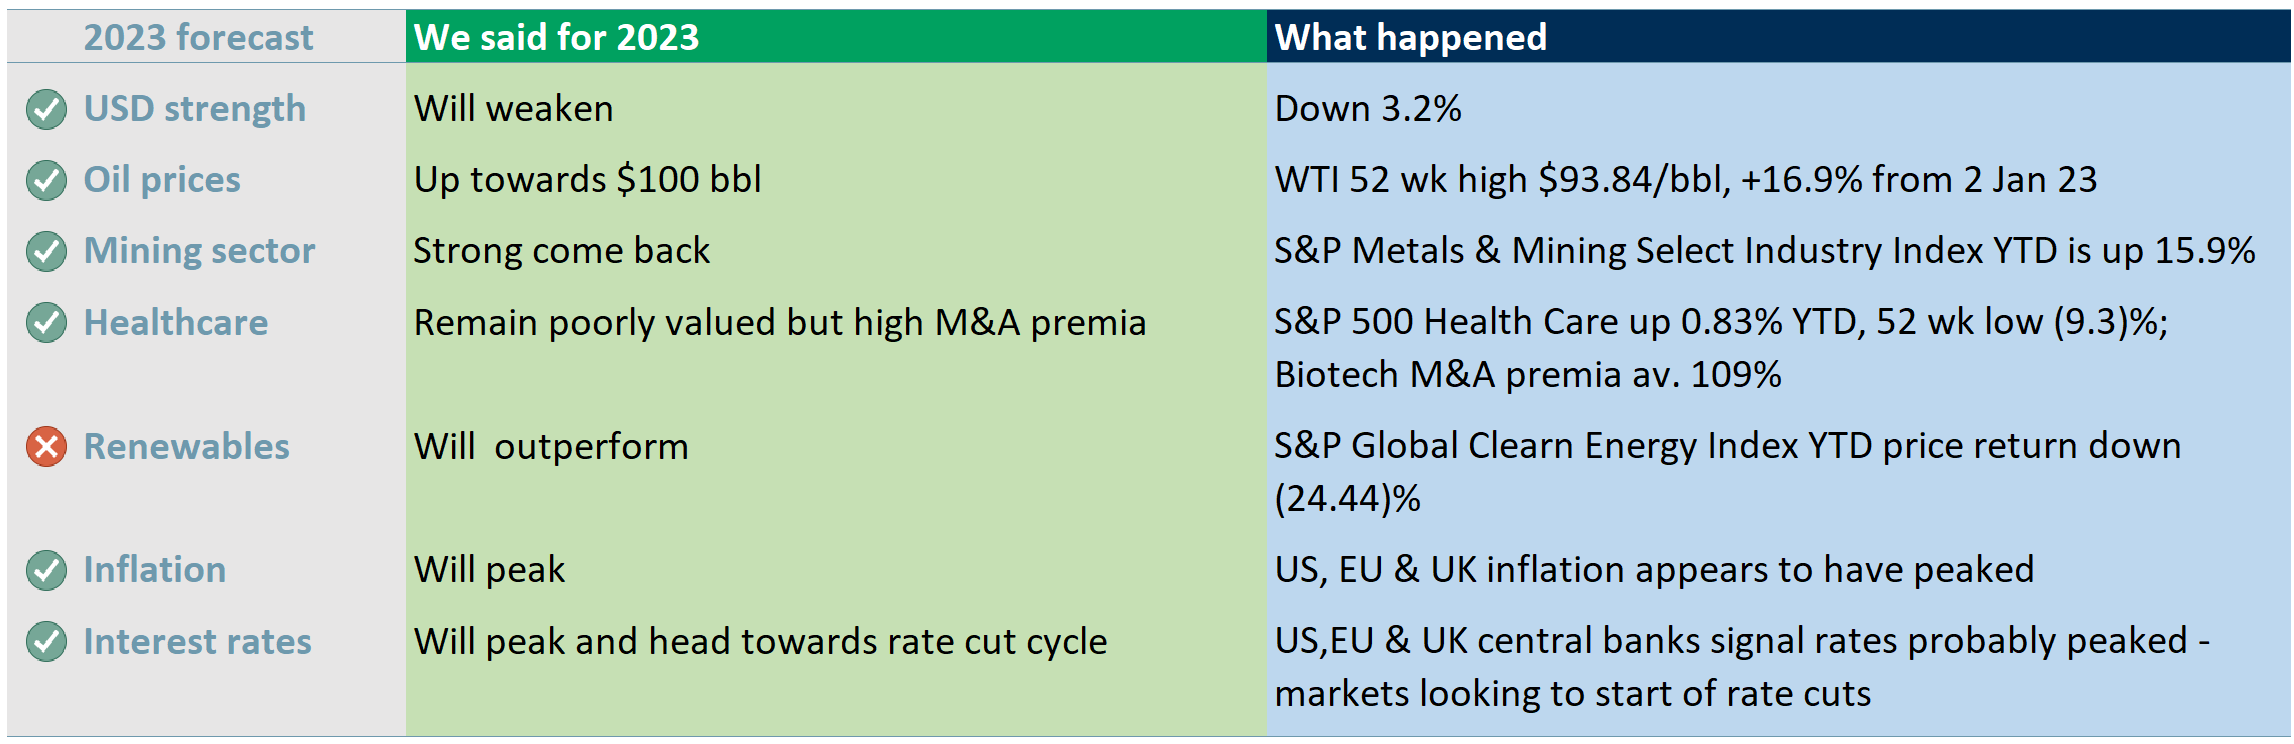
Our ACF Equity Research 2024 Outlook can be summarised by the words… ‘clearer skies’… by which we mean more clarity on the trends, rather than a more hospitable world – the good news is that markets prefer clarity above all else. First, let’s see how we did in 2023 to see if it is worth you reading further (See exhibit 1 below).
Exhibit 1 – What ACF Equity Research predicted for 2023 and what happened
 Sources: ACF Equity Research Estimates & Graphics.
If you wish to verify and compare our assessment in the table above with what we published at the beginning of 2023 – we point you to our inaugural outlook ACF Outlook 2023
Highlights – ACF’s Outlook 2024
- Inflation and interest rates – inflation will continue to decline and rates will enter the cutting phase of the cycle.
- The US dollar will, we expect, continue to weaken in 2024.
- Oil prices will be range bound at US$80-US$100bbl excluding expansion of the Israel-Hamas conflict – nevertheless this may be the last time we see US$ 100+ bbl oil.
- The mining sector critical metals prices look positioned for an upwards re-rating as regional blocks attempt to dis-entangle supply chains from China.
- The healthcare biotech sub-sector in particular, will remain poorly valued outside of M&A deals, the deal premia may compensate for poor price performance and will come with very significant premiums.
- Renewables will continue to attract strong investment interest – renewables indices ‘deserve’ a positive re-rating but we may not see this in 2024.
- AI will change our world as computers did in the 1980s – some jobs will disappear forever but mostly it will be about learning to use the tool on a day to day basis and particularly within company operations. Many jobs will become less tedious.
ACF’s outlook for 2024
Geopolitical Tensions – setting the scene – The Russia-Ukraine war, the largest attack on a European country since World War II, seems destined to enter its 3rd year and markets have priced this in. Energy supplies have been re-sourced to a meaningful degree in Europe (gas prices running into winter are back down to their long run average). Wheat prices have also re-adjusted to more usual levels – Ukraine’s predicament with respect to wheat production is no longer driving supply inflation in wheat prices.
Israel-Hamas war – tensions go back to 1989 – the most recent (October 2023) conflict has potentially catastrophic supply implications for oil via escalation, though so far this is looking relatively unlikely.
The Israel-Hamas conflict, at some level, is destined to drag on for years if not generations – either that or the sheer horror and ferocity of the encounter started by Hamas’ atrocities will cause everyone to come to the table (excepting Hamas).
Houthi rebels, who are based in Aden, southern Yemen, may make a difference to oil prices with their ongoing Iran supported rocketing and raiding of Red Sea oil, grain and other commodities trade vessels. The Israel-Hamas conflict has triggered increased Houthi activity by way of proxy support for Hamas from Iran.
Russia-Ukraine – as indicated in our 2023 Outlook, the RU-UA war would force Europe to reset its fossil fuel policies, and it did. The EU scaled back its fossil fuel supply from Russia – by 2Q23 RU EU petroleum imports fell to 4% vs 21.6% y/y. Natural gas imports fell to 2.5m tonnes vs. 5.1m for the same period.
We also suggested that if Ukraine was able to successfully enter Crimea, it could be Putin’s downfall. In August 2023, Ukraine’s navy and military intelligence managed to carry out a ‘special operation’ in Crimea. Ukraine is also working on regaining control and making Crimea part of its economy again.
President Putin is gambling (probably correctly) on a new Trump presidency in the US, which he is convinced will starve Ukraine of money and arms. Mr Putin does not believe that Europe has either the resources or the compunction to take up the slack if the US backs away from material aid – again, worryingly, he is probably right.
These ongoing geopolitical tensions, plus US China trade spats, have impacted global trade but excluding Houthi Red Sea rockets, markets have priced in the trade impacts. Nevertheless, global trade will have declined around 5% y/y in 2023E (once the data comes in) due to increased trade finance and insurance costs.
According to the UN Conference on Trade and Development (UNCTAD) the value of goods and services in 2023 is estimated at $30.7trn vs. $32.2trn in 2022. This 8% decrease in the value of global trade in 2023 is largely a function of lower merchandise trade, i.e. supply chain disruptions, which themselves are exacerbated by high inflation and high interest rates.
Geopolitical tensions will impact trade in other ways. Countries involved in conflict often experience a range of trade restrictions, sanctions and embargoes as we have seen with Russia. Conflicts can also disrupt transportation (shipping and air) trade routes as we have seen with the Israel-Hamas war. Tensions can create a global ripple effect and significant uncertainties for businesses operations.
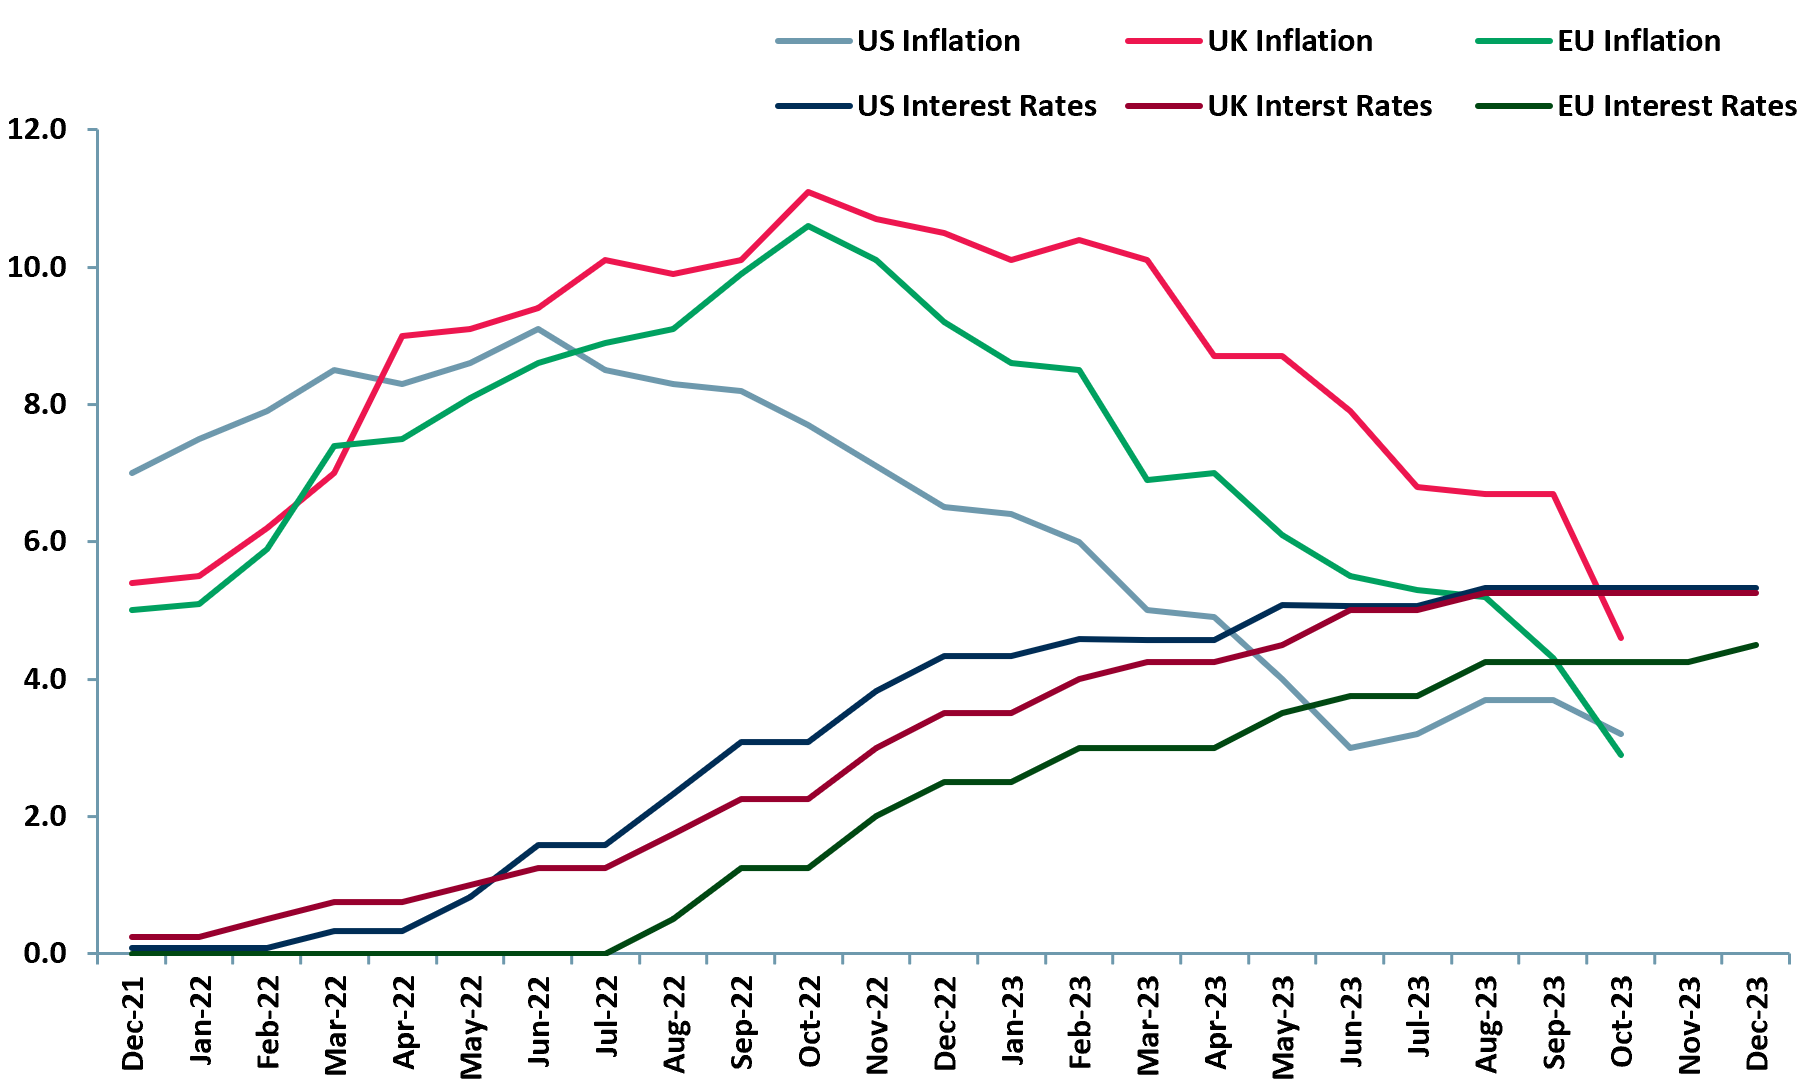
Inflation vs. Interest Rates – United States, United Kingdom and Europe – For the UK, 2024 looks tricky, inflation is receding but it is still double the Bank of England’s 2% target. The EU and the US appear in step, with falling inflation rates at around the same level.
As we forecast in our 2023 outlook, we expected the rate cutting phase of the cycle to be in sight. Late 4th quarter the US Fed has signalled that the next moves will be downwards, we expect similar behaviour from the Eurozone’s ECB.
We are expecting rate cuts from the UK’s Bank of England too, but probably after the US and Eurozone. The UK is subject to reasonably resistant supply side inflationary pressures and firmly baked in inflation expectations. No one who goes to the supermarket currently believes food prices will stop rising any time soon and no one who buys coffee or goes to restaurants believes that the employment supply side effect of Brexit is anywhere close to washing through.
Nevertheless, we still forecast that the UK will enter the rate cutting cycle before the end of 2024.
Exhibit 2 – US/UK/EU inflation rates vs. interest rates (%) Dec 2021 – Dec 2023
 Sources: ACF Equity Research Graphics; Statista; BoE; ECB; MacroTrends.
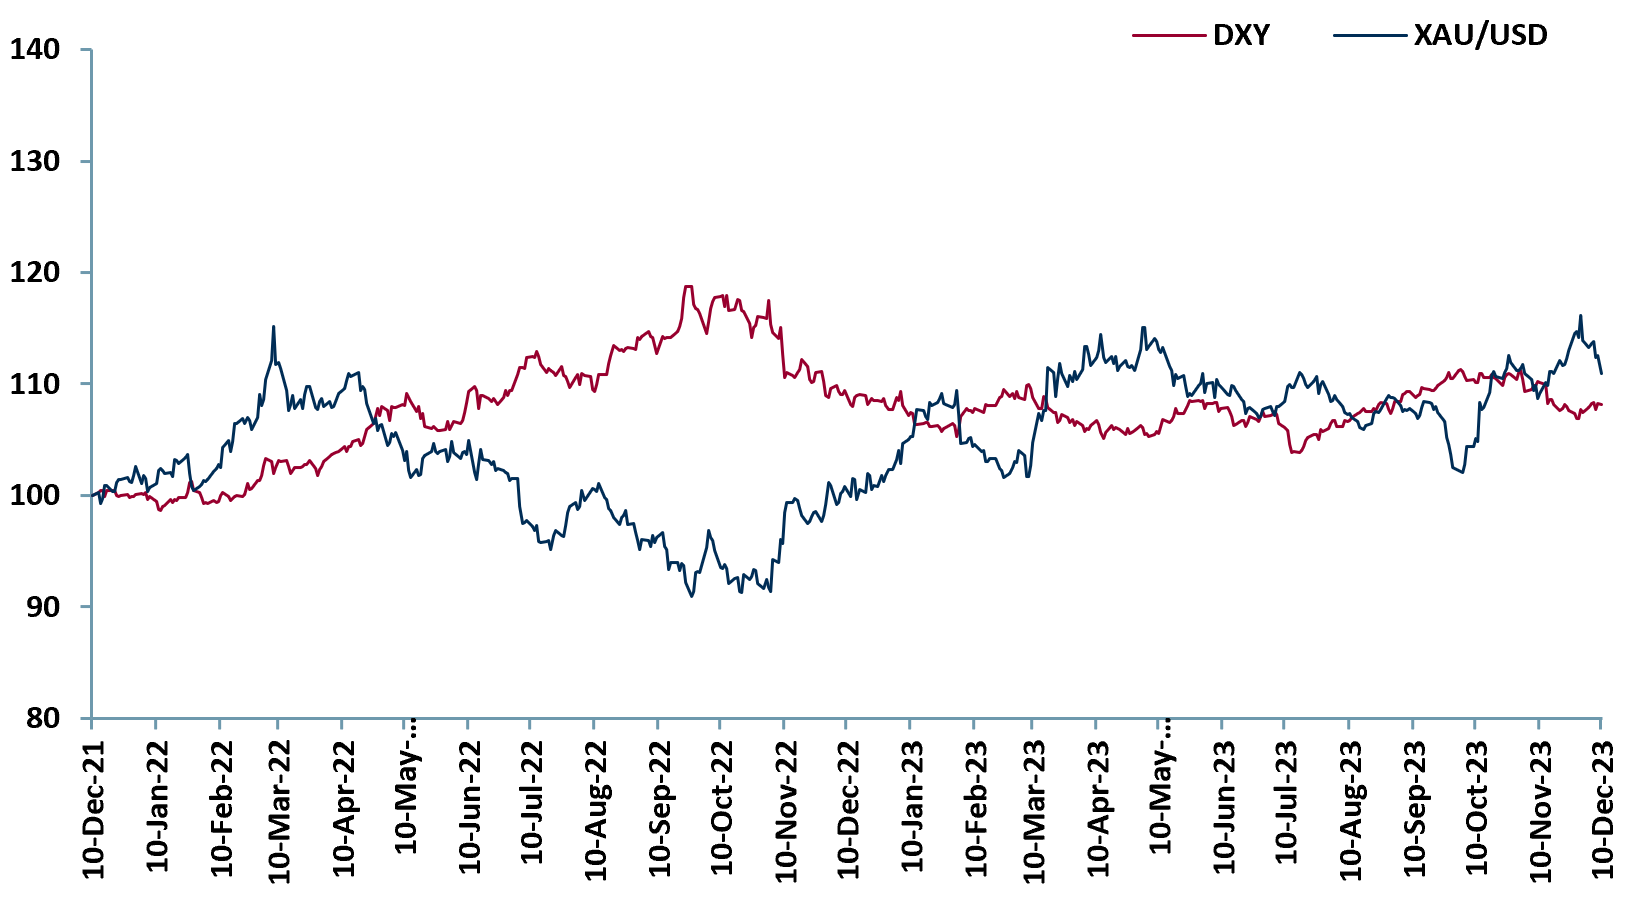
US dollar dominance fading and Gold – We expect gold prices to move higher in 2024 with support coming from safe-haven buying due to geopolitical concerns, expectations of rate cuts and weaker dollar. Federal Reserve in its recent meeting has indicated towards three rate cuts in 2024. This is likely to put pressure on the dollar which should be positive for gold.
With the U.S. central bank starting to embrace a more dovish stance, we could be in further rallying gold prices in 2024, after a strong 2023 (up nearly 11% year to date). We note that lower interest rates increase the appeal of holding zero-yield bullion. The ongoing geopolitical tensions (i.e. the Russian-Ukraine war, Israel-Hamas war) should continue to make gold a valuable hedge. Further, continued central bank buying should provide additional support for gold.
Exhibit 3 – US Dollar Index (DXY) vs Gold Spot Price (XAU/USD) indexed Dec 2021 – Dec 2023
 Sources: ACF Equity Research Graphics; Investing.com.
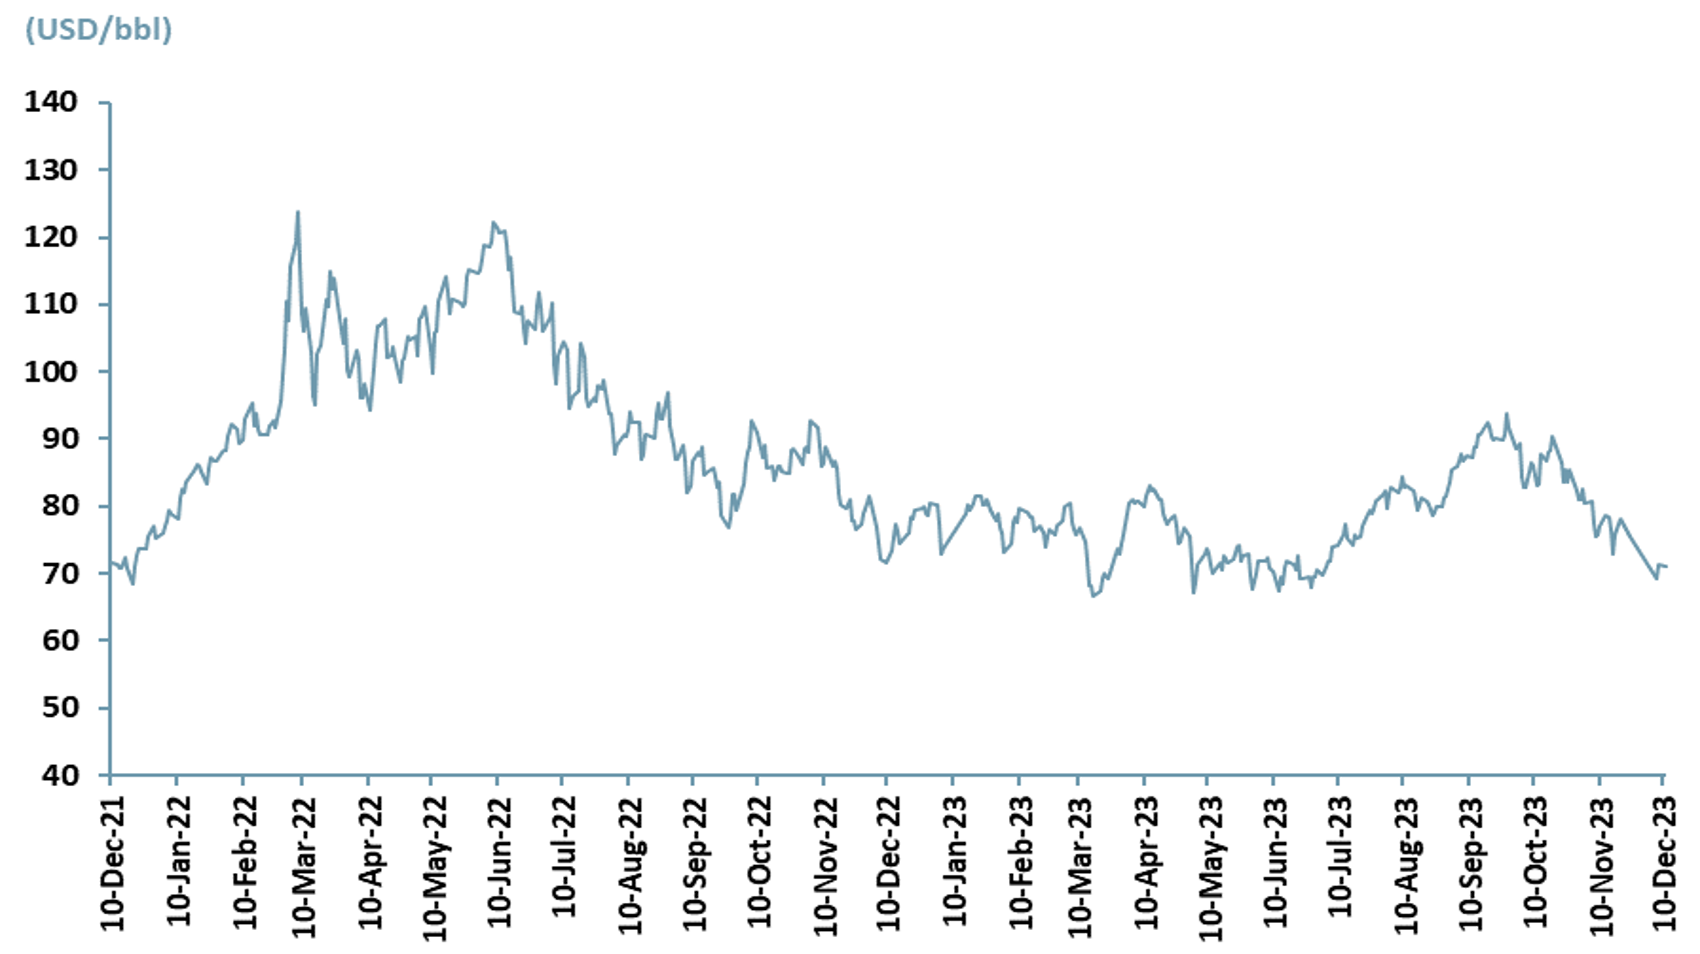
Oil – We expect crude oil to remain rangebound at $80-$100 per barrel (currently WTI is a little north of $70 bbl) supported by production cuts from OPEC including the recent decision by several members to join Saudi Arabia and Russia in implementing additional cuts in 1Q24E.
At the latest OPEC+ meeting at the end of November, the organisation announced cuts of 2.2m barrels per day (bpd). Saudi Arabia and Russia announced that they will roll over their current cuts of 1.3m bpd while supply cuts totalling nearly 1m bpd will come from new voluntary reductions by other producers.
Weak global growth could impact demand but OPEC, as seen in 2023, has shown a tendency to keep supporting the oil price by cutting production, a policy we believe will continue in 2024. The high-end of our forecast factors in the deterioration of the conflict in the Middle East which would, inevitably, lead to supply disruptions.
It is possible that 2024 could be the last year we see $100 bbl oil. Two factors have caused us to consider this possibility…
- We assess that we are heading for another significant inflexion point in EV production and adoption. Car manufacturers and others are now excited about this prospect and their supportive practical and communications activities will apply pressure to governments to ensure that charging infrastructure can support EV sales growth.
- OPEC recognises that to prolong the life and so value of oil as a transportation energy supply, it is important that oil prices are not high enough to stimulate innovation and or accelerate roll out of renewable energy alternatives and infrastructure. EV sales and automakers positioning in late 2023 and developments at COP etc., have got OPEC’s attention.
Exhibit 4 – 2-year WTI Crude Oil prices Dec 2021 – Dec 2023
 Sources: ACF Equity Research Graphics; Macrotrends.
Critical Metals Mining – Lithium – Is lithium the new oil? This analogy comes from lithium’s critical role in the manufacturing of lithium-ion batteries, which are essential for powering electric vehicles (EVs). The oil analogy is further shaped by the increased demand for lithium.
Even though the price of lithium has fallen in 2023, new mines are under development and construction to meet expected demand. Average mine development life from prospecting to production is around 17 years – a lot of this time is taken up by permitting and paperwork. We expect these development timelines to contract – AI will play an important role.
China maintains its role as the leading market player in the lithium value chain. In 2021 China produced 14,000 MT of lithium-ion batteries. China imported 65% of its raw lithium materials supply. The Chinese government also subsidises battery and EV production in order to reduce the price impact of imports. To divert the reliance on China, countries such as Australia and Chile are enhancing their downstream capabilities, which will also move these countries up the value chain. Chinese dominance may be on the way out.
Lithium supply and demand is also influenced by trade policies, e.g. the US-Mexico-Canada Agreement imposes rules of origin that force North American vehicle manufacturers to localise component production, which impacts the sourcing of lithium-ion batteries.
Rare Earth Elements (REEs) – without REEs lithium has no role because REEs are currently essential for changing the energy stored in a lithium-ion battery for an EV to actually work (making the wheels turn). Without REEs in permanent magnets, lithium has no role as the ‘new oil’.
Exhibit 5 – Lithium carbonate price Dec 2021 – Dec 2023
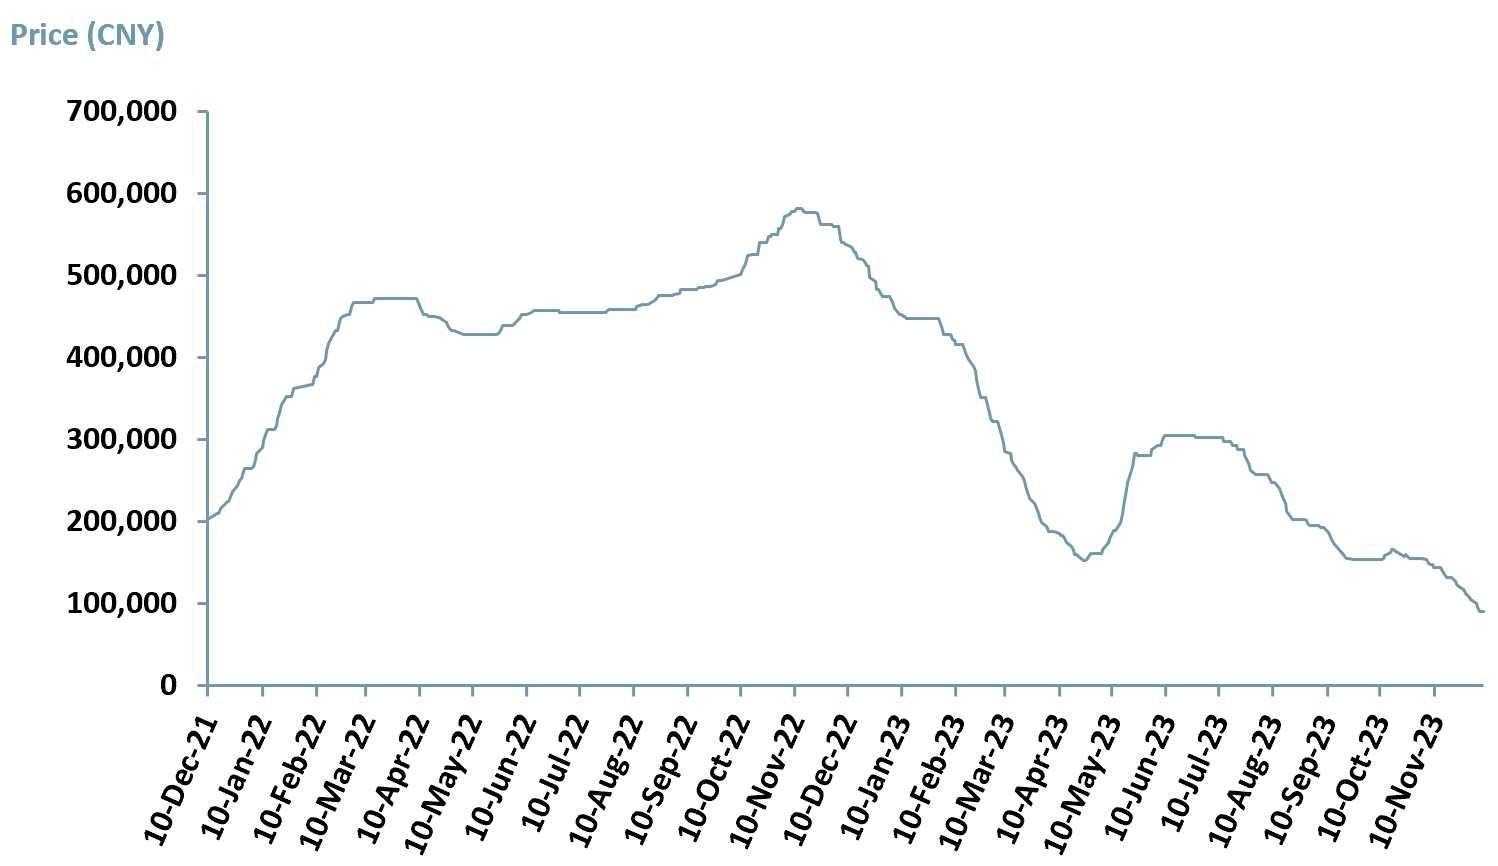 Sources: ACF Equity Research Graphics; Investing.com.
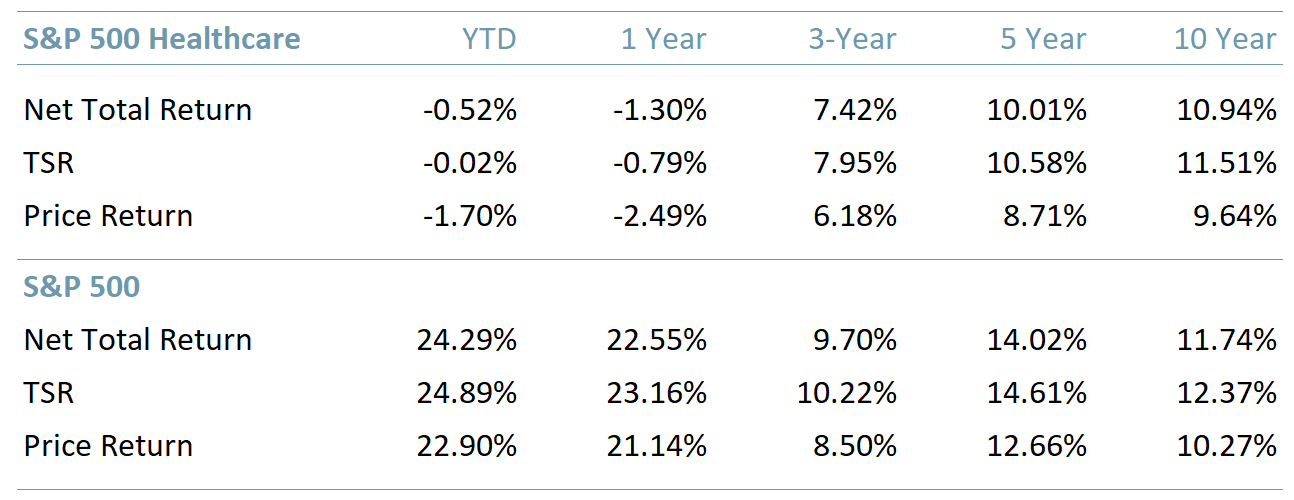
Healthcare – Healthcare stocks, as evidenced by the S&P 500 Healthcare index, have remained persistently undervalued throughout 2023, printing over 5 years of under- performance vs. the S&P 500. See exhibit 6 below. M&A biotech deal premiums have however delivered extraordinary returns – see exhibit 7 below
Exhibit 6 – Comparison of return measures for S&P 500 Healthcare index vs. S&P 500 index, showing sustained underperformance of healthcare equities over 5 years.
 Sources: ACF Equity Research Graphics; S&P data.
M&A premiums over time run up to about 40% for successfully integrated deals. Anything over a 40% control premium deserves specific investigation to understand why such super-normal premium are justified. Control premia in the biotech sector were habitually above 40% in 2022 and 2023. In 2023 we estimate that average biotech deal premiums have exceed 100%. We do not expect this to change without a major sector re-rating.
We introduced our hypothesis to explain the deal premia vs. the sector under performance over 3 years ago and it continues to hold up to inspection – the real value in biotech stocks is only crystallized via M&A transactions for two key reasons.
- Investment risks in healthcare remain poorly understood by both retail and institutional investors, leading to under-valuation outside of M&A transactions.
- In contrast, the business managers on either side of the biotech M&A transactions understand the potential value of the assets in question.
As a more general rule, it is worth repeating that the market reacts very well to good news from healthcare stocks, with significant overnight re-ratings, but is especially savage on healthcare sector stock-specific ‘bad news’. We predicted this overshoot behaviour would continue in 2023 and we do not expect this to change in 2024 unless the biotech sector undergoes a very significant re-rating.
In part the healthcare sector information asymmetry (particularly for biotech), and so the subsequent mispricing, is due to a market failure, which in the end is a failure of market communication strategies and content.
Outperformance and underperformance – In 2024 healthcare stocks indices will continue to under-perform. However, biotech company share prices will react dramatically and positively to good news especially PII and PIII positive news and will suffer punishing falls in value for misses. The gains will not be sustainable and the falls will not be recovered without effective communications strategies, that are currently, largely absent.
Without a significant biotech sector re-rating (read better market understanding) M&A premia are likely to remain very high by historical standards.
Exhibit 7 – Biotech deal premia in 2023 where public data is available – All M&A premia in our cohort are above the long run M&A maximum control premium of 40% for successful integrations.
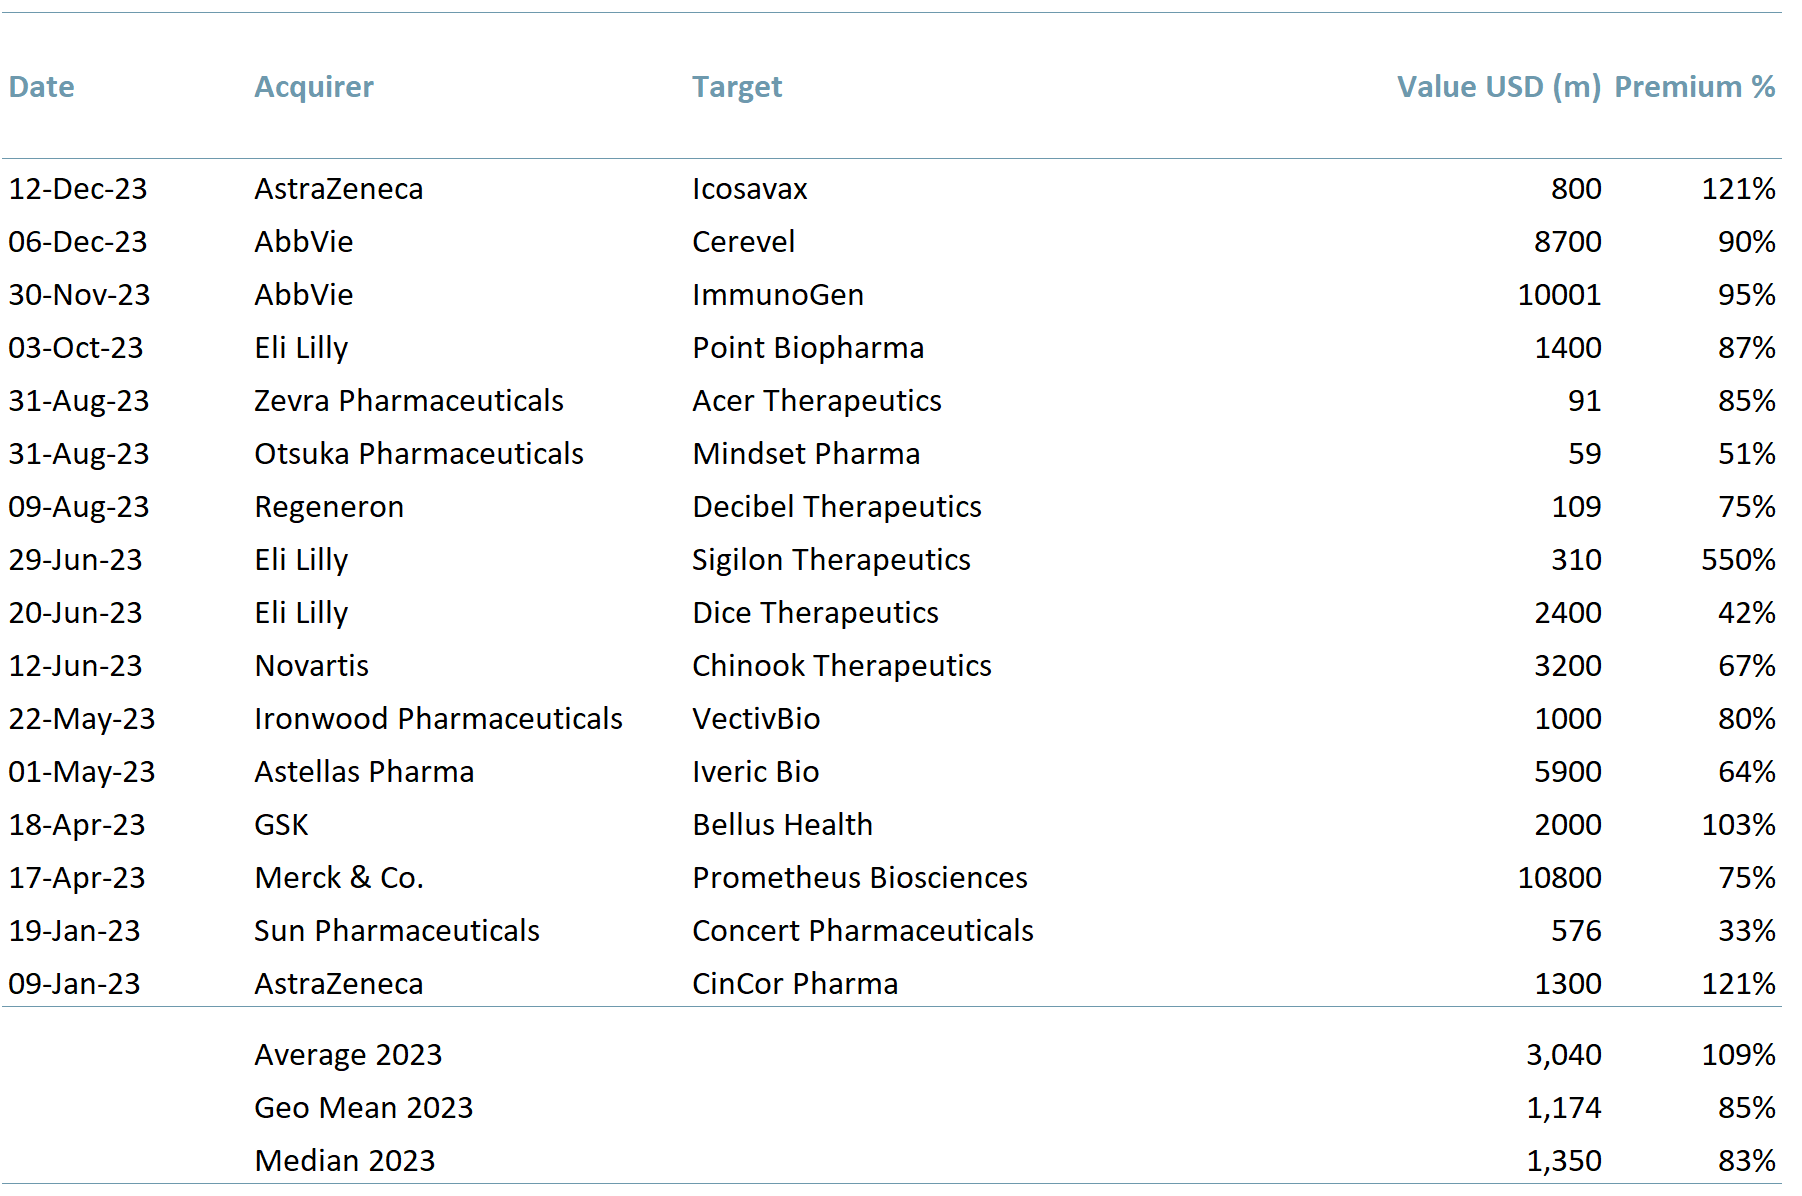 Sources: ACF Equity Research Estimates & Graphics; Financial markets data sources.
Renewables – The renewables market in 2023 has shown significant developments influenced by geopolitical events, economic conditions and technological advancements. Renewables are expected to make up the bulk of the global power mix by 2050E, 35% (IEA). We are going to bet again on renewables in 2023 in spite of renewables delivering the one rinsing we got on our 2023 outlook. Below, we present our arguments for a re-rating of renewables equities in 2024.
- Growth and Market Trends: Renewable energy continues its rapid growth trajectory, largely driven by solar and wind power as LCOEs (key standardisation metric for the cost of electricity generation) have decreased and projects are being taken over by large companies either from or rather than smaller companies. Solar PV capacity is estimated to increase by 30x by 2030 vs 2021 and wind capacity is estimated to increase by 4x by 2030 vs. 2021 (McKinsey).
- Investment: Renewable energy investment hit a high in 1H23A of US $358bn (BloombergNEF), though renewable energy indices in 2023 have not conveyed that impression. China still leads the market contributing $177bn or 49% of the US$ 358bn invested in renewables. The US comes a paltry second contributing just $46bn, with Germany 3rd at $11.9bn.
- Unless western countries ramp up investments in renewables, China is likely to continue to dominate market share. In the longer term, developed economies cannot afford for China to be the dominant provider of renewable energy equipment and power.
- Recall that the marginal cost of renewable energy production tends to zero, so the economic challenge is not just the supply chain, it is the competitive advantage it would gift China as the dominant and leading renewable energy economy.
- Energy Security and Changes in Policy: The focus on energy security has been amplified by the Russia-Ukraine war and the Israel-Hamas war. Both wars have impacted trade routes, disrupting supply and leading to more volatile energy prices.
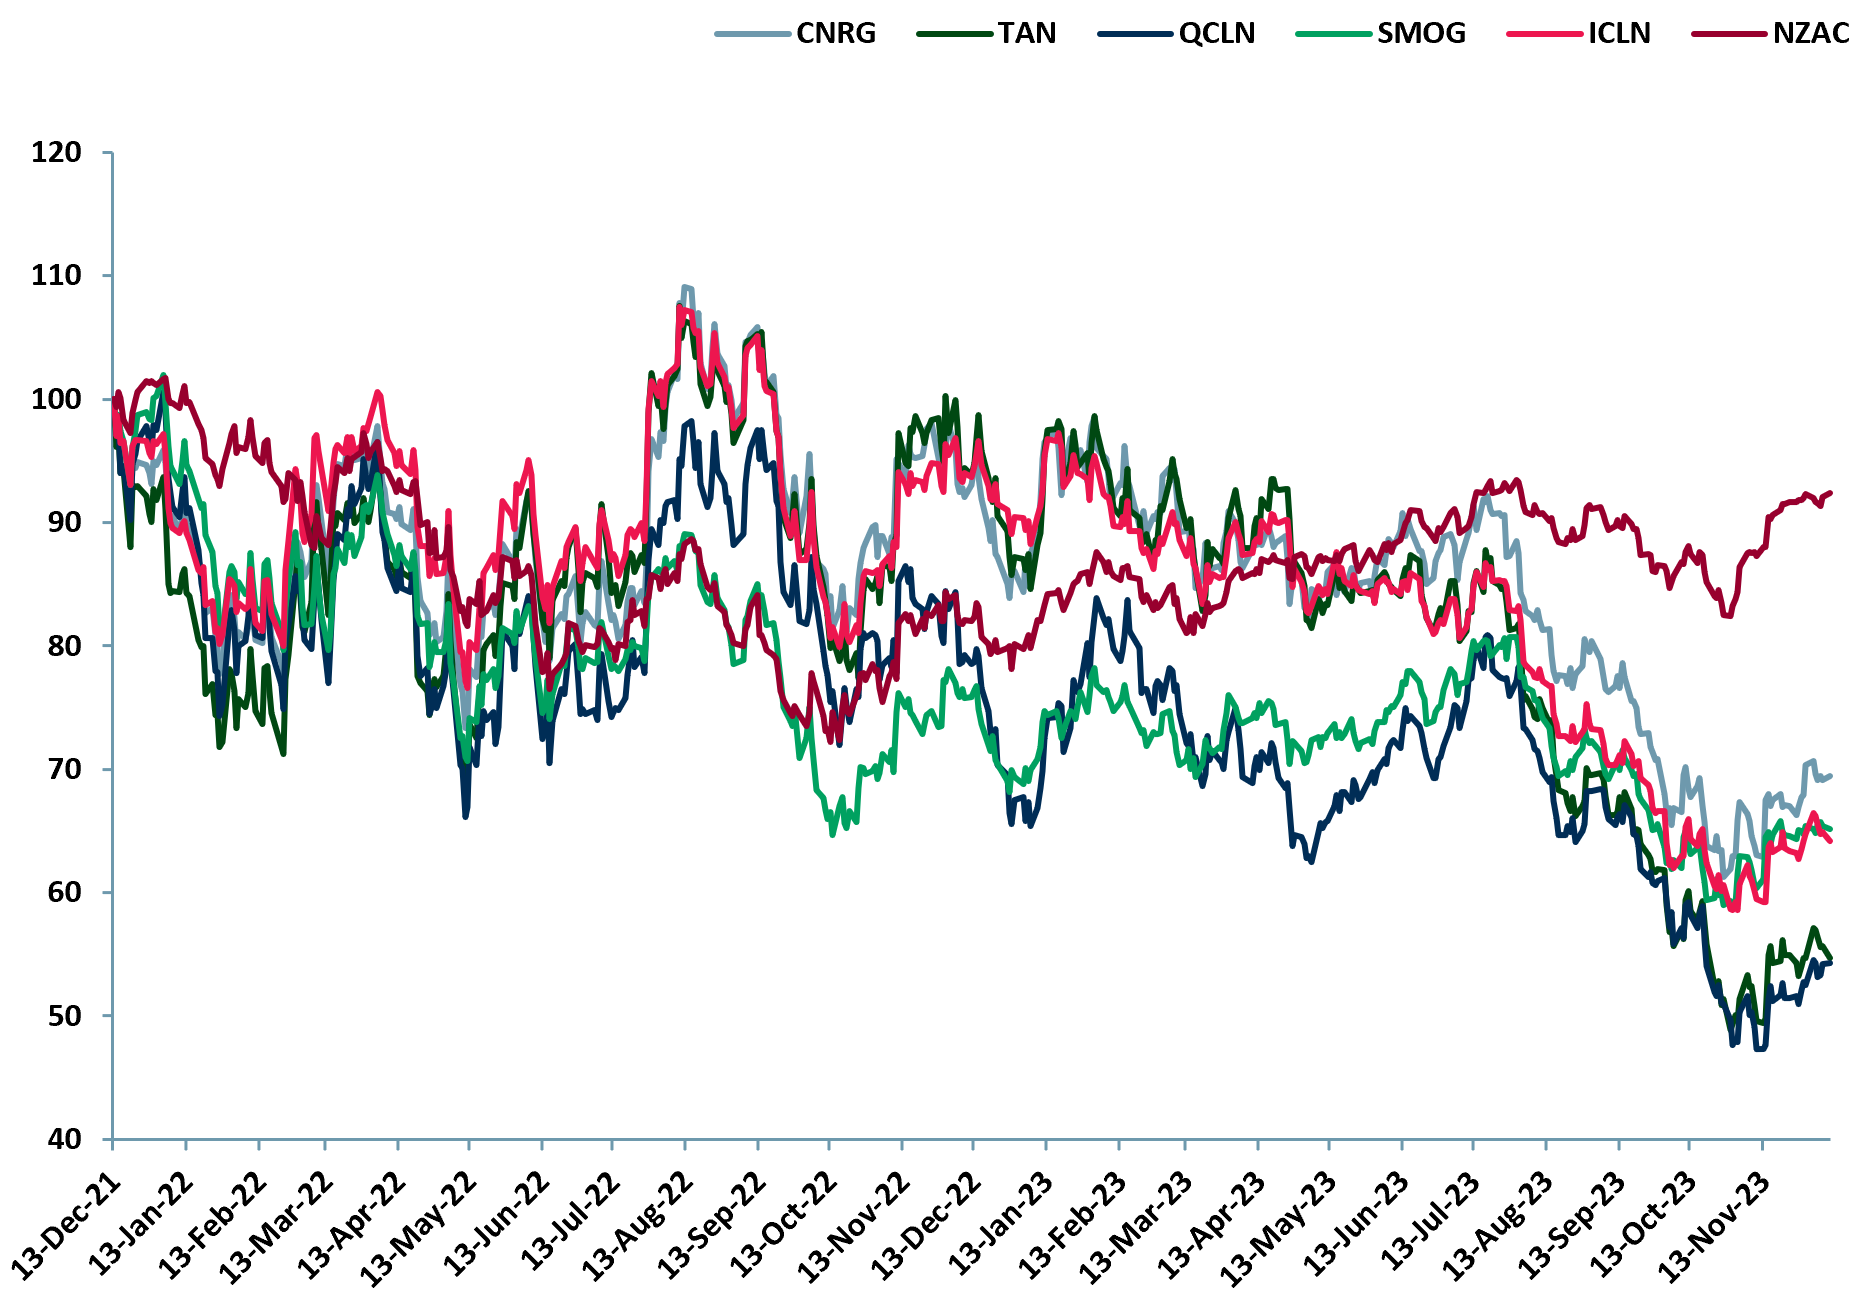
- ETFs: The significant growth in renewable capacity, combined with large-scale investments and policy support, suggests a favourable environment for Renewables/ Clean Energy ETFs. Increased corporate renewable energy capacity, especially in the U.S., also signals a robust market for renewable investments. Nevertheless, equity performance has been positively withering (the S&P Global Clean Energy Index rose 7.5% during the first 17 days of 2023, which was a painful false dawn, the index is now down ~24% YTD).
Below we chart the best performing renewables / clean energy ETFs: SPDR S&P Kensho Clean Power ETF (NYSE:CNRG), Invesco Solar ETF (NYSE:TAN), First Trust Nasdaq Clean Edge Green Energy Index Fund (Nasdaq:QCLN), VanEck Low Carbon Energy ETF (NYSE:SMOG), iShares Global Clean Energy ETF (Nasdaq:ICLN), and SPDR MSCI ACWI Climate Paris Aligned ETF (Nasdaq:NZAC – the ETF performance has also been pretty dismal until around November this year. The performance momentum in the final quarter of 2023 might provide enough forward motion for ETF re-ratings in 2024.
Exhibit 8 – Best-performing Renewables / Clean Energy ETFs price relative Dec 2021 – Dec 2023
 Sources: ACF Equity Research Graphics; Refinitiv.
AI – Artificial Intelligence, it is reasonably safe to say, will continue to be a driving theme in 2024. Much has been written about AI and most of it overblown, as is ever the case with hot trends. We consider the AI revolution to be much like the computing revolution – many fears will not come to pass in respect of employment and ‘Skynet’ scenarios.
The emphasis, in our assessment and experience, will be on learning to use AI as a common place and essential work place tool, much like computers are now. AI is no replacement for creativity or indeed intellectual acuity, it is an aid – it lightens the burden of certain tedious activities and allows professionals to focus on greater value add.
Some jobs will go or be very differently defined. On balance though, AI will reduce tedium at work and increase the amount of time required or available for intellectual and creative work.
Managing and respecting property rights is the greatest danger for markets with respect to AI, but positively, we see policy moves to try and tackle the property rights issue (property rights are the basis of all functioning developed economy markets).
Businesses not deploying or understanding how to deploy AI operationally will either go out of business within the next 12 months or exist in ultra niche markets – somewhat like vinyl records or bespoke saddle makers.
In many cases AI operational innovations will be passively adopted by businesses via Microsoft (MSFT) products and Alphabet (GOOG) services, that in our view will also continue to be the mega-cap winners in the race for AI dominance. However, a word of caution – current earnings expectations are beginning to stretch the imagination for the leading mega cap stocks in the AI space.
Index outperformance or underperformance overview – key regional indices for hyper developed economies and China
Below we provide a quick visual reference on relative performance of the financial markets regions over the last 24 months.
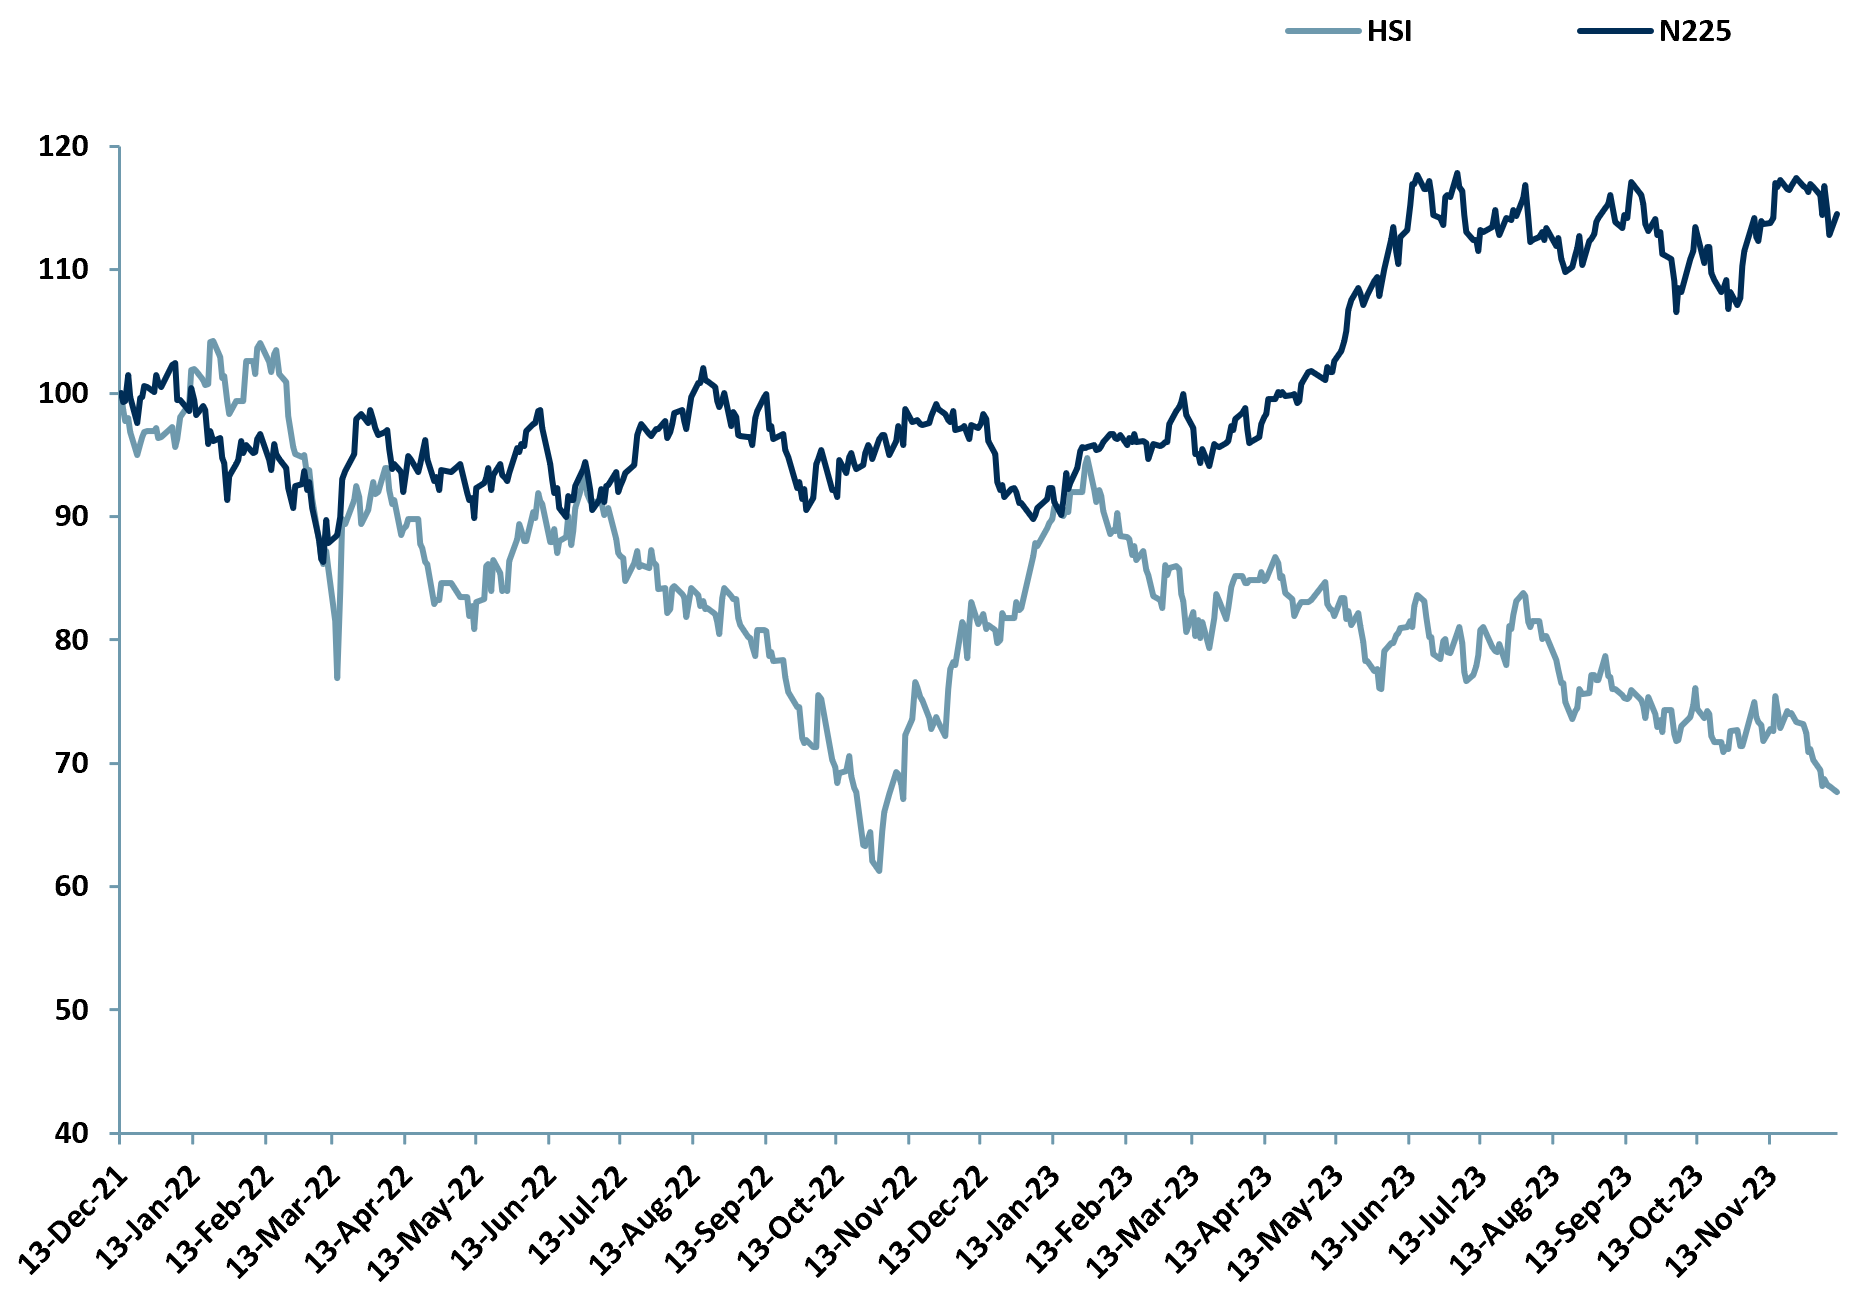
China has under-performed Japan. Unreliable macro statistics, the property bust and softening local sentiment, have a lot to do with China’s underperformance in 2023. We do nevertheless expect China’s economy to keep expanding above the 3.5% global average growth rate for GDP. China is looking a lot less vibrant and may not exceed 4% GDP growth in 2024.
Japan has outperformed China for much of 2023 – this is a surprise given Japan’s structural economic challenges. Japan’s outperformance vs. China should act as a warning signal for other markets to price in a less exciting China growth.
Markets broadly believe that there will be much US/China posturing, and though this is worrying, markets believe that fundamentally the US and China are so economically interwoven with each other, that little will change in practice.
Exhibit 9 – HSI vs. N225, price relative Dec 2021 – Dec 2023
 Sources: ACF Equity Research Graphics; Refinitiv.
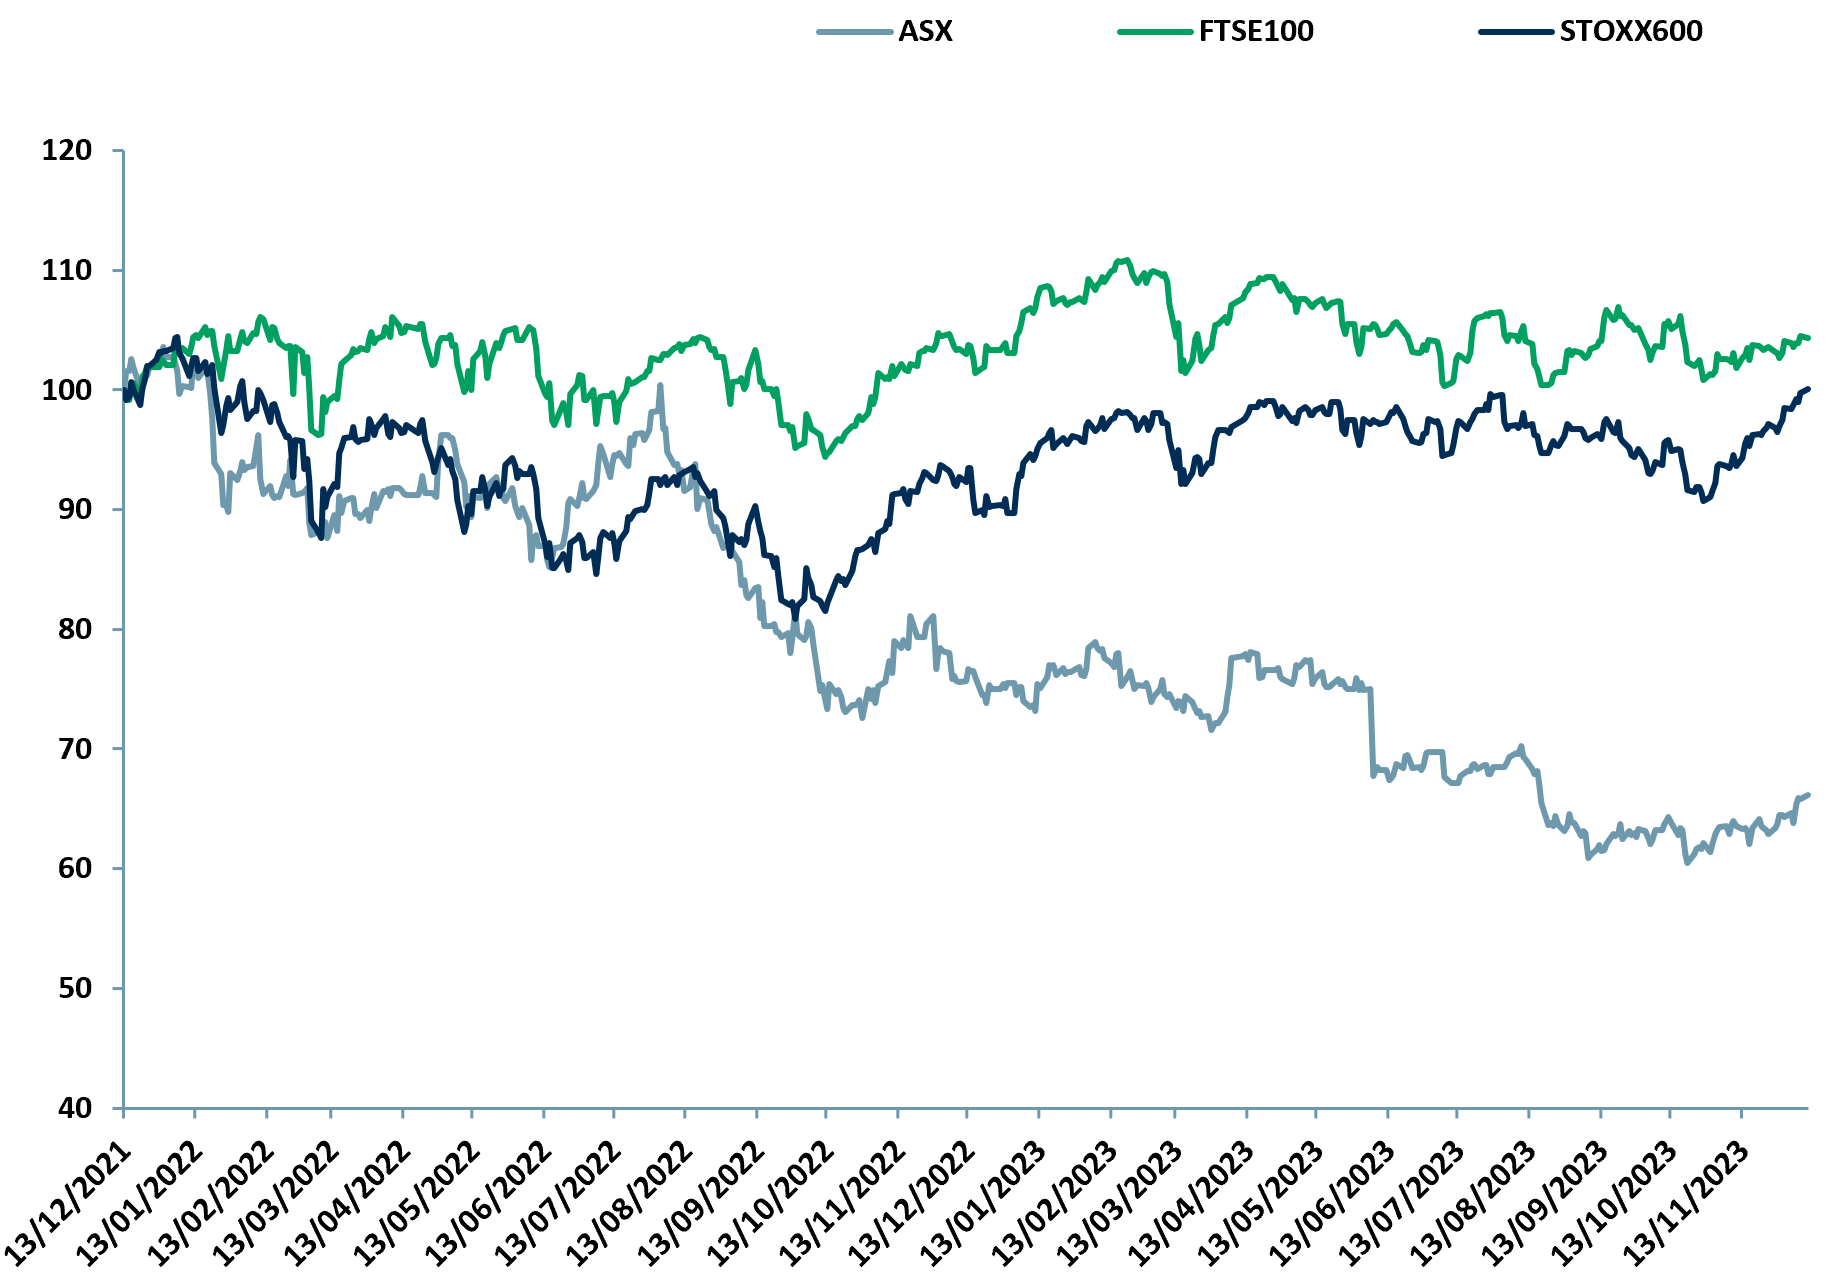
Australia has a had a pretty torrid year of it compared to the UK and Europe, in line with our core investment case analysis for the Australian Stock Exchange. The year-end finish is looking a little more promising for the ASX, probably driven by an expectation that lower interest rates are around the corner.
Exhibit 10 – FTSE100 vs. STOXX600 vs. ASX, price relative Dec 2021 – Dec 2023
 Sources: ACF Equity Research Graphics; Refinitiv.
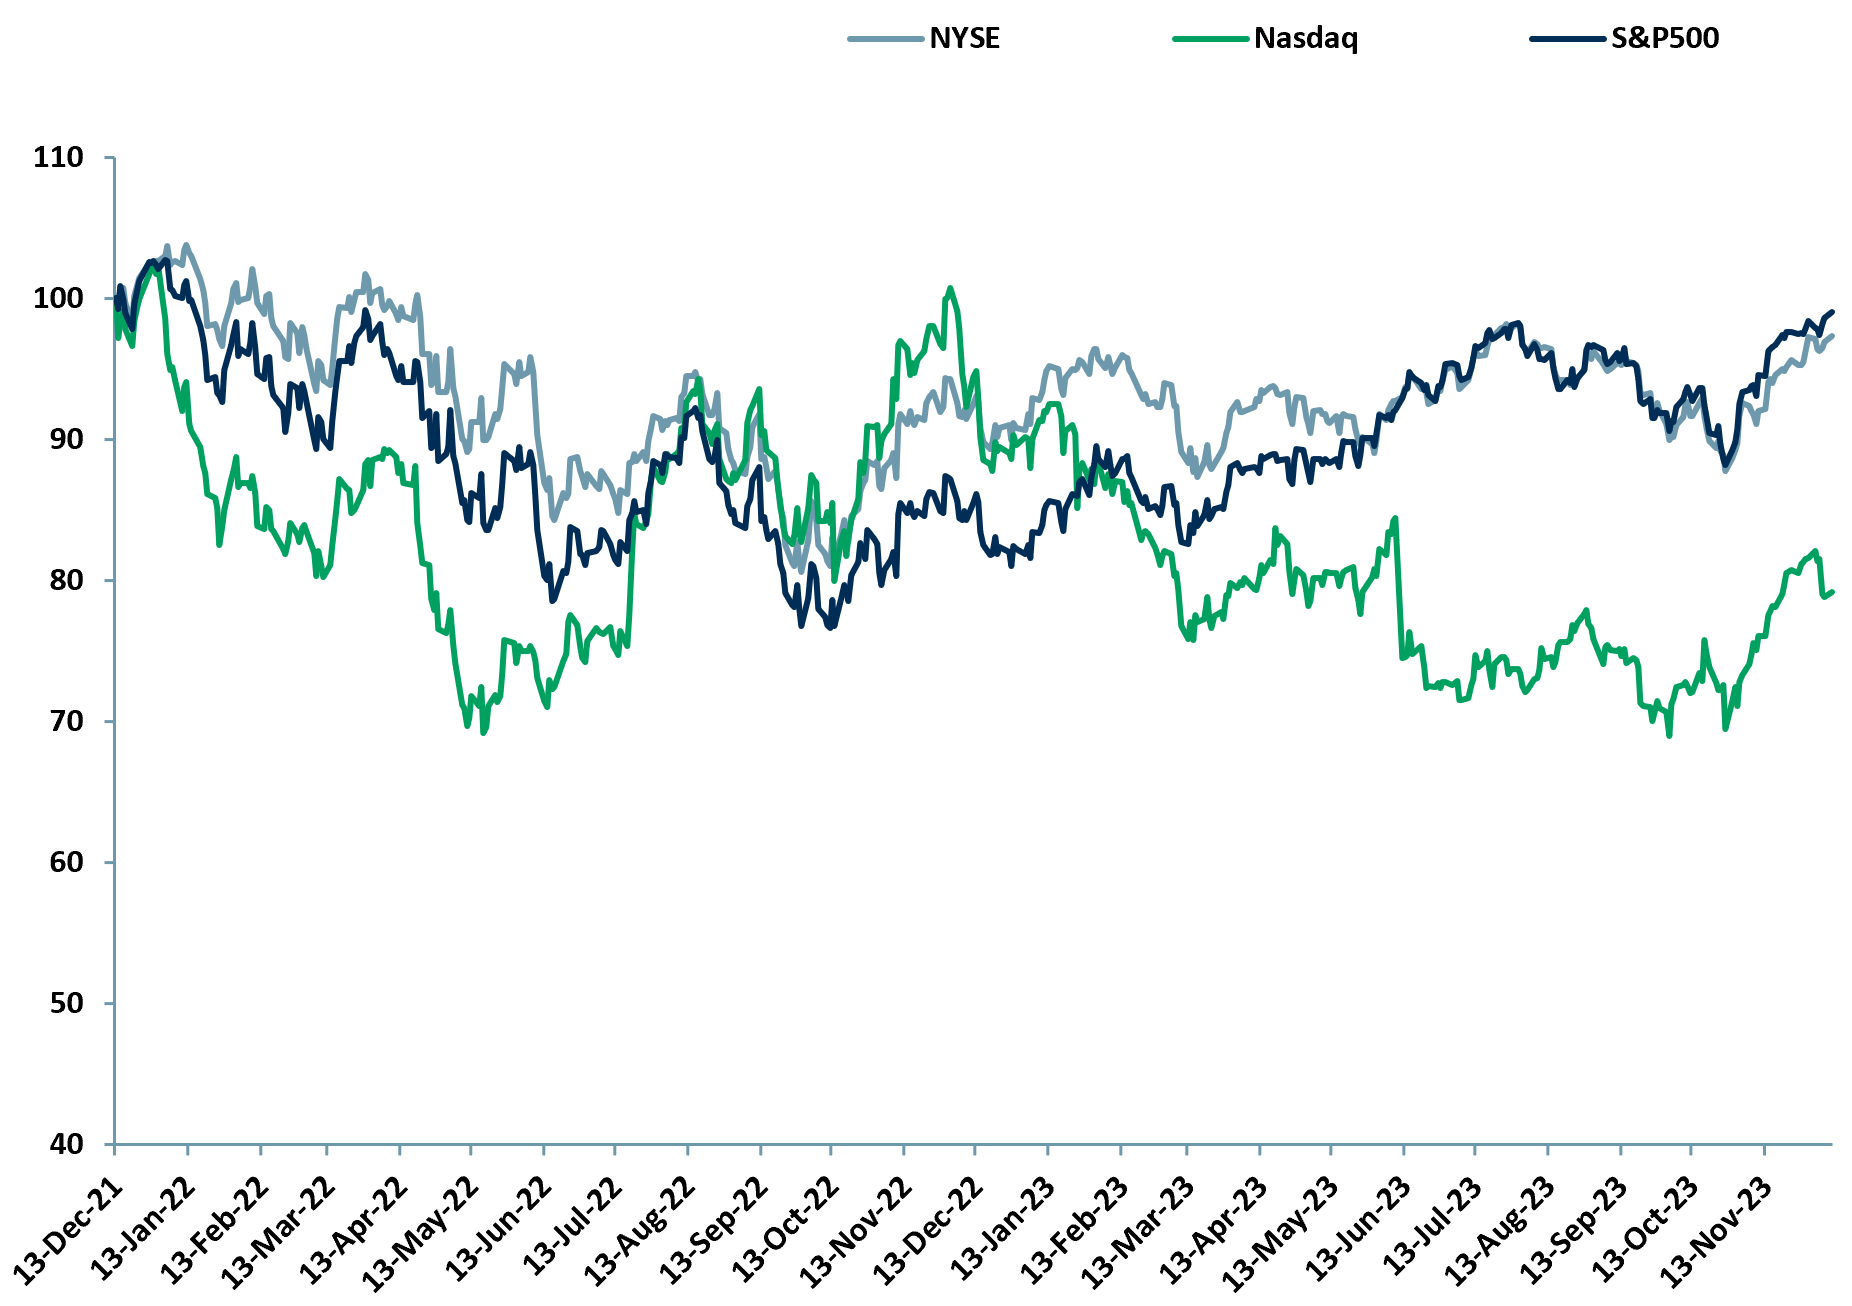
The S&P 500 net total return YTD is running at ~24% and the price return is running at ~23%. The Nasdaq looks like the laggard. Even so the finish to the year (so far) seems to be pricing in Fed interest rate cuts. A good finish would set the Nasdaq up for a potentially strong performance in 2024. It seems unlikely that the S&P 500 will repeat 2023’s performance. However, some beaten up S&P 500 sub-sectors could surprise to the upside.
Exhibit 11 – NYSE vs. Nasdaq vs. S&P500, price relative Dec 2021 – Dec 2023
 Sources: ACF Equity Research Graphics; Refinitiv.
ACF’s Outlook 2024 Summary
In 2024 we expect to see a weaker dollar and range bound crude oil prices (excepting the Red Sea threat). China growth will disappoint the media but it is largely priced in to markets. Inflation will continue to decline, interest rates will start to fall.
Critical metals prices are likely to gain some ground. Without strategic change, biotech will continue to be misunderstood by markets, though very high M&A premiums will most likely compensate investors for the underlying performance of the equities. Renewables will attract healthy investment flows and deserve rerating, which probably won’t happen in 2024.
AI will change everything, but much like computers did in the 80s rather than like ‘Skynet’ did in the Terminator movies. MSFT and GOOG will continue to be the mega cap AI winners, though current market expectations for earnings are somewhat ahead of reality.
Authors: Christopher Nicholson, Garvit Bhandari, Renas Sidahmed. Christopher is a founding executive, MD and Head of Research, Garvit is a Staff Analyst, Renas is Head of ESG and a Staff Analyst at ACF Equity Research. See their profiles here


