
Capital Markets – significant behavioural change
Our central theme is that markets and economies will never see anything other than a V-shaped crash or correction and recovery again. The cycle is also accelerating and deepening.
How does this faster recovery and change in shape in the markets benefit nano to mid-caps?
- A company’s money raising ability improves because markets are open continuously for longer periods.
- V-shaped declines and recoveries reduce the risk profile of your company, thereby increasing the valuation because your business plan suffers fewer structural interruptions.
- The potential and speed of new product innovation and success is increased.
Capital markets corrections, crashes and recoveries are increasing in speed, getting deeper, and are V-shaped – probably the new long-run paradigm. Our analysis leads us to conclude that there are permanent changes based on the contracting timescale of market recoveries since the 1929 Great Depression. These changes have significant impacts on nano to mid-caps.
The small firm effect and valuations – our analysis suggests that the probability of smaller and mid-cap companies not hitting their milestones because of market disruptions is significantly reduced. Therefore, for investors, the risk profile of smaller companies is reduced, meaning small company valuations should be higher – the small firm effect is enhanced.
Our analysis suggests a structural change in valuation (for the better) and smaller companies need to get that message across to markets and investors. This is achieved through third-party investment research.
Market recovery contraction – how has it evolved?
The Dow Jones Industrial index took ~25 years to re-gain its pre 1929 Great Depression highs.
Post the 2008 Financial Crash, the Nasdaq took ~3.5 years, the S&P ~5 years, and the FTSE 100 ~8 years to recover pre-crash highs. Arguably, post-Covid, markets only took ~40 days to reach their nadirs – a rapid correction (the DJI shed 11,000 points). But within ~8 months markets, in most cases, (the UK’s FTSE 100 being a notable exception) had regained their pre-crash highs.
The Covid pandemic became a global brand name on the 19th February 2020, when Italy’s Covid outbreak became market news.
Around 40 days later by the 20th March 2020 the US Dow Jones Index (representing the US’s largest industrial companies) had fallen 35%, the S&P was down 32% and Nasdaq and the UK’s FTSE 100 had both lost 30% of their value. The declines continued for around another three days.
During the crash phase the consensus was that the world had entered a very lengthy bear market and the prognosis for the global economy shortly after was considered, potentially at least, as severe as the 1929 Great Depression.
However, by the 15th July 2020, less than four months later, the Nasdaq was 7% above its pre-Covid high, S&P 5% below its all-time high, the DJI 8% below, the FTSE 100 was 16% below and the FTSE AiM (the UK’s main junior market) was 10% below.
While there was, for several months, a lot of public discussion around the different shapes of a recovery (U, L, W, K or V), our central theme is that markets and economies will never see anything other than a V-shaped crash or correction and recovery again.
The timescale for both markets and real economy recoveries has been gradually contracting since 1929. The Covid crisis seems to have accelerated that trend as it has accelerated so many other trends.
Exhibit 1 1929 Great Depression
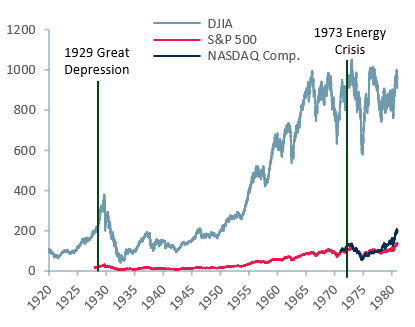
Exhibit 2 2008 Financial Crash
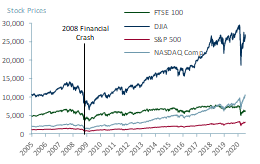
Exhibit 3 Covid Crash and Recover 2020-21

Our insight, early April 2020, was that recovery in financial markets was likely to take months and not years compared to previous crashes. We identified three main driving forces.
Recovery contraction – the three forces
- The rise of telecommunications infrastructure investment – in the 1990s there were trillion US dollar investments in telecommunications infrastructure (fixed line, mobile and satellite). Indeed, US telcos still hold ~US$ 1trn in debt related to these investments from the 1990s.
- The fall in the cost of computing – Moore’s law effect on chip capacity and growing economies of scale of production. In 1980 one US$ bought 10bn computations per second (cps). By 2010 one US$ bought 100,000,000bn cps (source: The Hamilton Project).
- Rapid economic development – in the 80s, China and India began rapid economic growth. China underwent economic reform and India embarked on banking reform – both producing a generation of individuals with an interest in capital markets.
- Between 1990 and 2015, Indian middle-class households ($10k plus disposable income) rose from ~2m to ~47m. India’s GDP rose from ~US$ 315bn to ~US$ 2.3trn over the same time period (sources: Euromonitor). We estimate there are ~60m US middle-class households. In 2019 US GDP was measured at ~US$ 21trn and China GDP was measured at ~US$ 14trn up from US$ 360bn in 1990 (source: World Bank).
The three forces – telco investment, chip density (dramatic declines in the cost of computations), and rapid economic development (particularly in China and India) led to both the invention of, and volume market for, smart phones. ~3.5bn people have smartphones in 2020, which equates to ~45% of the global population.
In our assessment, the effect of smartphone penetration on education, and access and interest in capital markets as a wealth generating mechanism, is difficult to over-estimate.
Furthermore, global communications and access to information have become faster, deeper and broader. These developments have gone a long way to levelling the playing field between professional market participants and retail investors.
In our experience, the lag between access to, or receipt of, market information of value between market professionals and retail investors has reduced. Thirty years ago, the time advantage for market professionals was anything from 6 months to 6 weeks. This market professional time and processing advantage has reduced, we assess, to between nearly zero and two weeks.
This means:
- a) far more individuals are influencing markets and so the impact of influence that powerful institutions have is much reduced and,
- b) all participants (retail and institutional/professional) are coming to similar investment conclusions over a much shorter timescale – perhaps 2-6 weeks.
The greater volume of participants and greater information and processing availability impacts both the crash phase, which is becoming steeper and faster, and the recovery phase, which is becoming less prolonged over time.
The outcome looks much more like a V-shape than any other, and we note there was no significant W either during the Covid crisis.
We conclude that investors can expect markets and the real economy (albeit with a lag) to respond in a V-shape from here on in – no more extended L-shapes or U-shapes.
Anticipating that the V-shape is the expected type of crash recovery cycle, has a positive impact on the nano, small and mid-caps. In short, corrections, crashes and recessions are easier to survive for companies because their duration is shorter.
Factor one – access to capital is closed for a shorter period of time.
Factor two – real economic growth returns much more quickly.
Factor three – a company’s risk profile is reduced, which leads to a higher valuation.
What do you need to do?
As a small company, how can you show investors there should be structural changes in your valuation as a result of market recovery contraction? How do you get your message in front of them?
The efficient and strategic way to do that is by having third-party investment research. Third-party investment research, distributed through effective digital channels, is your gateway to investors in the following ways:
- Research communicates your investment case
- Research reduces regulatory risk to management by providing a third-party view
- Research reduces the probability of market overshoot or undershoot and share price volatility – making your company more attractive to investors and reducing your cost of capital
Authors: Christopher Nicholson and Renas Sidahmed – Christopher is a founding executive, MD and heads up investment research analysis at ACF Equity Research. Renas is an award winning investment research analyst and part of the Sales & Strategy team at ACF Equity Research. See their profiles at https://acfequityresearch.com/team/


