Taxing copper – where prices are going
Copper futures took a hit at the end of August 2021 as Chile’s government approved a royalty bill that could create a severe tax burden on the industry and China factories shut down for Covid.
Is Chile’s recent copper tax bill advance and China’s latest series of shut downs threatening to repeat the impact on copper futures?
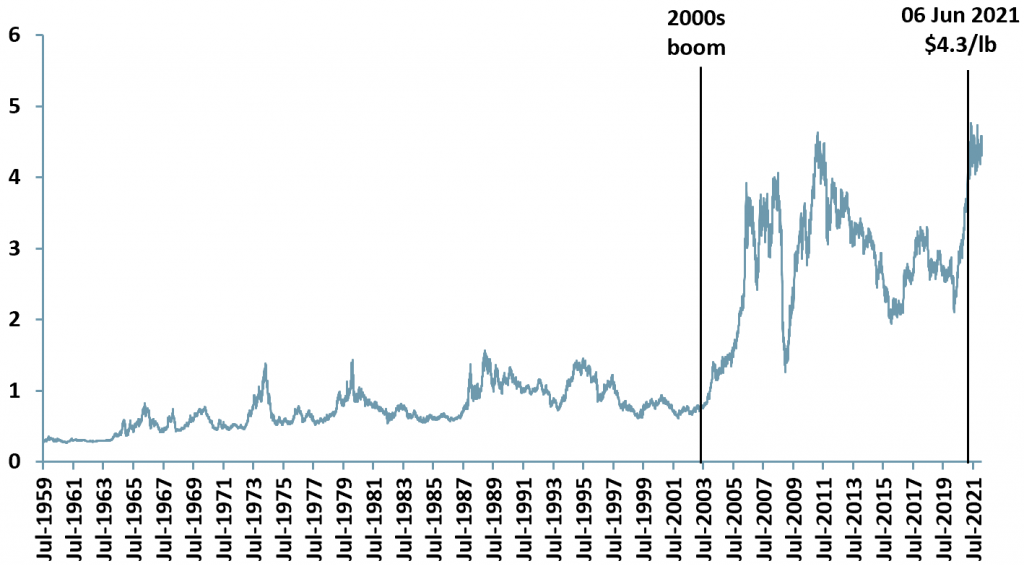
Although futures were hit last time around the spot price came in at $4.3/lb on 06/06/2021 ~22% higher than at the beginning of 2021 ($3.6/lb) as a result of shrinking inventories, supply disruptions in Chile and increased demand from China (exhibit 1) after a v-shaped recovery.
By 10/09/2021 the price of copper reached $4.5/lb and is currently trading around $4.6-4.2/lb.
- On Tuesday 31 Aug, the Chilean senate approved a bill that could create a heavy tax burden among major copper producers. On 1 Dec 2021 Chile advanced the mining tax bill a step closer to becoming reality.
- The Chilean tax bill seeks to impose two taxes 1) a 3% tax on sales over 12k tonnes p.a. of copper and over 50k tonnes p.a. of lithium and 2) a progressive tax based upon the price of copper.
- Chile seeks a bigger share of mining profits to help fix the economic effects of the pandemic.
- Chile also plans to increase output by 57% over next 30 years and this seems to be at odds with a progressive tax plan.
- The copper industry warns that the Chilean copper tax bill is in danger of delaying investments in copper and lithium and hinder competitiveness in a country that accounts for >25% of global copper production.
- Delayed exploration and production of copper would feed into copper prices (pushing them upwards) and so the progressive element of the tax looks like it could create a negative feedback loop, in which higher copper prices further discourage investment, which in turn raises copper prices, and so on and so forth.
Exhibit 1 – Copper spot price 1959-2022
 Sources: ACF Equity Research Graphics; Macrotrends
A history of copper booms and busts – where we have come from
- 1950s-1960s
Following WWII, price controls were imposed on copper. The UK government wanted to avoid any price volatility following the price hike in 1949 as a result of post-war reconstruction, automobile booms and the devaluation of sterling (GBP). By 1950 the Korean War was increasing global copper demand via strategic stock piling by governments.
In 1951, the US government set a price ceiling on domestic copper at 24.6c/lb. The US controlled producer prices for US consumers, keeper them lower than the price of the rest of the world paid. This caused a copper shortage.
In the UK the London Metal Exchange (LME) carried out a government programme to fix the price of copper. The US government set prices in the US and the LME set prices for the rest of the world. The effect was the creation of a market with two separate prices for copper – a situation that lasted for the next 20 years.
- 1970s
After the Korean War, copper demand continued to grow due to a new round of stock piling. This was spearheaded by the US stockpiling for the war in Vietnam and the 1971 Nixon Shock. (US President Nixon executed a series of doomed economic measures to try to curb inflation, such as wage and price freezes).
In addition, the 1973-74 oil crisis (oil prices rose ~300%) and the US’s release of price controls pushed copper prices higher – reaching £1,400/ton (~$60c/lb – as the market re-established supply demand equilibrium pricing).
- 1980s-1990s
In the 1980s and 1990s, the price of copper generally declined on the back of the early 1980s recession. High interest rates, which curbed global investment, and so global demand, pushed down prices of all commodities.
On the other hand, technology advances and the divestiture of copper companies from oil majors helped to lower or keep production costs under control.
- 2000s boom
In the 2000s, the price of copper increased more than 4x to $3.57/lb in July 2006, up from $0.86/lb in Dec 2019. This was driven by the astounding rate of industrialisation and demand coming out of China. The country underwent significant urbanisation and so construction and rural areas were electrified (both major uses of copper), more individuals aspired to owning motorised vehicles and millions of PCs and cell phones were sold.
Since 2017, copper prices have continued to increase on the back of demand expectations created by former President Trump’s infrastructure plans in the US and Chinese demand that accounts for more than 50% of global consumption. In addition, copper’s increasing role in renewable energy infrastructure (e.g. wind turbines and solar panels) has also contributed to increased demand.
The markets perception is that there will be no softening of demand for copper as the global trend to convert to renewable energy (largely electricity) picks up where demand created by China’s booming economic growth may (or may not) reduce.
The copper market today
Leading uses of copper – Copper (Cu) is a soft, malleable, and ductile metal. Because it is a good conductor of heat and electricity it is mainly used in electric equipment such as wiring and motors, construction (roofing and plumbing) and industrial machinery (heat exchangers).
Copper production – In 2020, total global copper production was 20m tonnes. Chile is the world’s largest producer – 5.7m tonnes in 2020, followed by Peru at 2.2m, China 1.7m, Democratic Republic of Congo (DRC) 1.3m and the US at 1.2m tonnes.
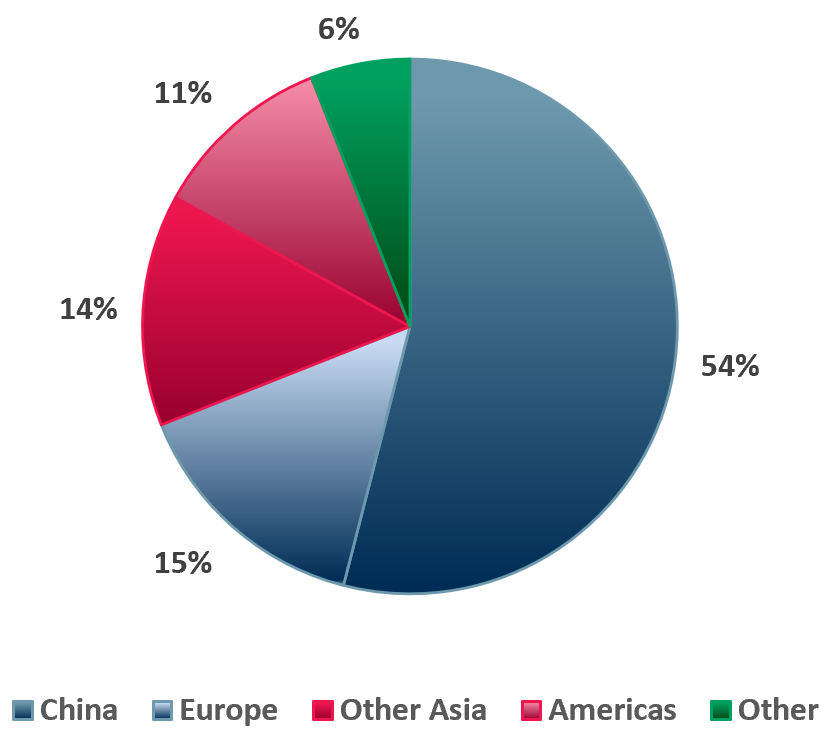
Copper consumption – Copper consumption was 22.9m tonnes in 2020E (according to Norilsk Nickel). China is the largest consumer of copper at 54% in 2020, followed by Europe 15%, Other Asia 14%, Americas 11% (exhibit 2).
China’s consumption of copper is driven by copper’s critical component status in manufacturing and construction. In 2019, manufacturing accounted for ~30%, US$ 4trn, of China’s total economic output (28.7% of total global manufacturing output) – putting it ahead of the US which came in at 16.8% of global output (UNSD).
Exhibit 2 – Global copper consumption by region 2020A
 Sources: ACF Equity Research Graphics; Norilsk Nickel
Where copper prices are heading
Copper prices continue to rise, reaching an all-time spot price high on 3rd May 2021 of $4.68/lb – $10k+/ton (LME copper futures) and maintaining a record trading range at the start of 2022.
The US is expected to raise interest rates as guided, which should strengthen the USD, as copper is priced in USD, the expectation of rising interest rates acts as a dampening effect on copper prices.
Chile’s tax bill (which includes a progressive tax on the price of copper) has moved forward another step, which, ceteris paribus, will act as a dampener on production investment and possibly current production.
What, therefore, are the expectations for the copper market rally?
Copper prices are forecasted to reach $20k/tonne over the three year period mid-2021 to mid-2024 (Bank of America). However, in July 2021 China announced that it would release copper from its national reserves in order to control prices.
China’s copper price control policy appears to us to be doomed to failure. Price controls never work for long because prices make up the information signalling mechanism in markets used to efficiently allocate capital and because such policies generally have unintended consequences, such as unemployment and reduced investment.
China’s price control policy also seems to take no or little account of the global conversion to renewable energy (mostly electricity), which seems to us to be more than capable of absorbing any copper reserves China may be able to put into the market, at least over periods longer than the very short term.
Because copper is a highly conductive and durable metal it is in high demand for electric vehicles and EVs new infrastructure demands (charging stations network). Like many analysts, we expect electric vehicle growth out to 2040E to be extremely strong. Strong demand usually supports prices.
Industrial action may also play a role in raising or supporting copper prices by limiting or making supply unreliable (adding risk, which raises costs).
On 10 September 2021 Codelco, the world’s largest copper producer and owned by the Chilean government, reached a deal that ended a three-week strike. Workers had used high copper prices as leverage. On this occasion production levels of copper were broadly maintained, but that may not always be so.
Chile’s attempt to bolster government revenues through a progressive tax on copper based on higher copper prices is potentially damaging for Chile because it is likely to damage mining investment appetite in the country – without investments to maintain copper mining output levels, Chile’s output lead could fade or at least reduce compared to its competitors, giving it less market power.
As it stands, the gap between supply and demand for copper is widening. Even though prices are high – thanks to the US infrastructure bill, China’s ongoing demand and the expected global green energy transition, demand remains high and growing.
At the same time the market is facing a supply deficit as mining companies are unable to ramp up production and Chile’s tax policy movement is only helping increase expectations of a widening supply gap and so higher copper prices.
| Copper’s Chile royalty bill |
|
Chile’s bill would make investing in copper production more expensive. The bill will add additional rates on sales of copper of about 15% for prices of $2-2.50/lb and up to 75% when prices go above $4. Funds from royalties will be used to fund regional development projects and finance projects to repair environmental impacts from mining activities. According to Goldman Sachs, this new legislation could place ~1m tonnes of annual copper output (~4% of global production) at risk. Furthermore, copper mines in Chile that are owned by foreign entities have tax stability agreements. These are due to expire in 2023. This lag could potentially limit any bid to lift copper royalties and future mine production could be in jeopardy. |
In exhibit 3 we show a peer group of the top five publicly tradeable copper stocks: Rio Tinto Group (NYSE : $RIO), Glencore ($GLEN : LSE), Freeport-McMoRan Inc. (NYSE : $FCX), Southern Copper Corporation (NYSE : $SCCO)and Hudbay Minerals Inc. (NYSE : $HBM).
Exhibit 3 – Peer group of copper producers
 Source: ACF Equity Research Graphics; Refinitiv, Exchange rate: (Source: XE.com) GBP vs USD: 1.3651
Authors: Renas Sidahmed and Christopher Nicholson – Renas is a Staff Analyst and part of the Sales & Strategy team and Christopher is MD and Head of Research at ACF Equity Research. See their profiles here


