
Tesla – a model for supply chain de-risking
Tesla (NASDAQ:TSLA) and the auto industry in general may become the de-facto model for de-risking supply chains within the OEM market (OEMs are original equipment manufacturers – they make things from components bought from other companies). Tesla’s strategy could eventually trigger a critical minerals / natural resources M&A frenzy.
As the demand for EVs grows (currently mainly due to climate change concerns) the demand for graphite needed in the batteries that power EVs is also growing.
As global supply chains remain unreliable (still recovering from the pandemic) and there is a new emphasis on security of supply post the pandemic experience, alternative supply chains for graphite are needed.
Electric vehicle (EV) producer Tesla (NASDAQ: TSLA) made a deal for graphite supply in Dec 2021 with Australian Syrah Resources (ASX:SYR), which operates the large Balama mine in Mozambique. Securing graphite from the Mozambique supplier is an effort to reduce Tesla’s reliance on China, which dominates the graphite supply chain.
By way of a recap:
- Tesla (NASDAQ: TSLA) will collect its graphite from Syrah Resources’ processing plant in Vidalia, Louisiana (USA). Syrah ships the graphite from the Mozambique Balama mine to Louisiana thereby entirely circumventing the China supply chain risk.
- Syrah’s Balama project (mine) in Mozambique is among the largest graphite mines globally. Syrah says it has the plant capacity to produce 350k MT of 94-98% fixed carbon graphite concentrate/year.
- Balama has estimated combined proven and probable reserves of 114.5m MT (av. TGC grade 16.6%) and flake graphite estimated at 18.9m MT. Balama’s M+I+I resource estimate is 1.19bn MT @TGC grade 11% (mining technology.com).
- China, by comparison, in 2020 produced 762k MT of graphite and was expected to increase production by ~7.5% to 820k MT in 2021.
- Tesla plans to purchase ~80% or 8,000 tons of the initial 10,000 tons per annum production expected from Syrah’s US processing plant, Vidalia, beginning 2025E (The Associated Press). This is part of Tesla’s plan to scale up battery capacity and increase US domestic production.
- Tesla has ramped up its EV production to ~1m/year, but sourcing enough batteries is the challenge. (China currently dominates the graphite market with share of estimated global production 2021A at 82% [USGS]).
Does Tesla create new risks for itself by de-risking its OEM supply chain?
China remains Tesla’s largest global market for EVs, which could become a headache for Tesla after the Syrah graphite supply chain deal. Tesla’s factory in Shanghai sells ~450k vehicles per year compared to ~350k in the US (Guidehouse Insights).
Tesla’s solution is to create a dedicated supply chain of its own, which could convey significant competitive advantage to Tesla and is probably a well observed lesson by other auto manufactures and by OEMs in other sectors.
It is not just the auto industry that needs de-risked graphite supply chains
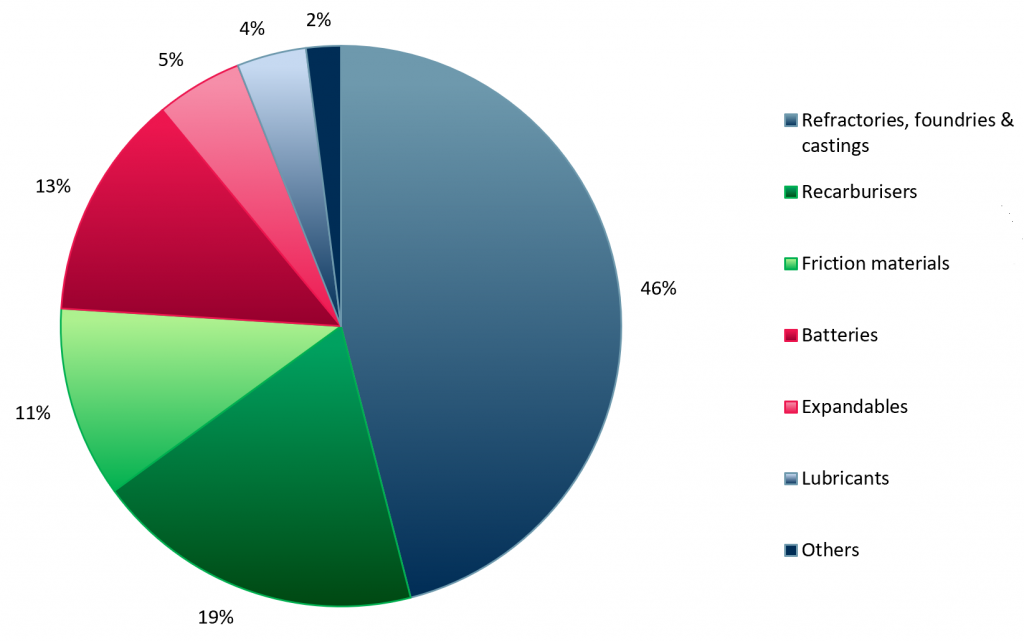
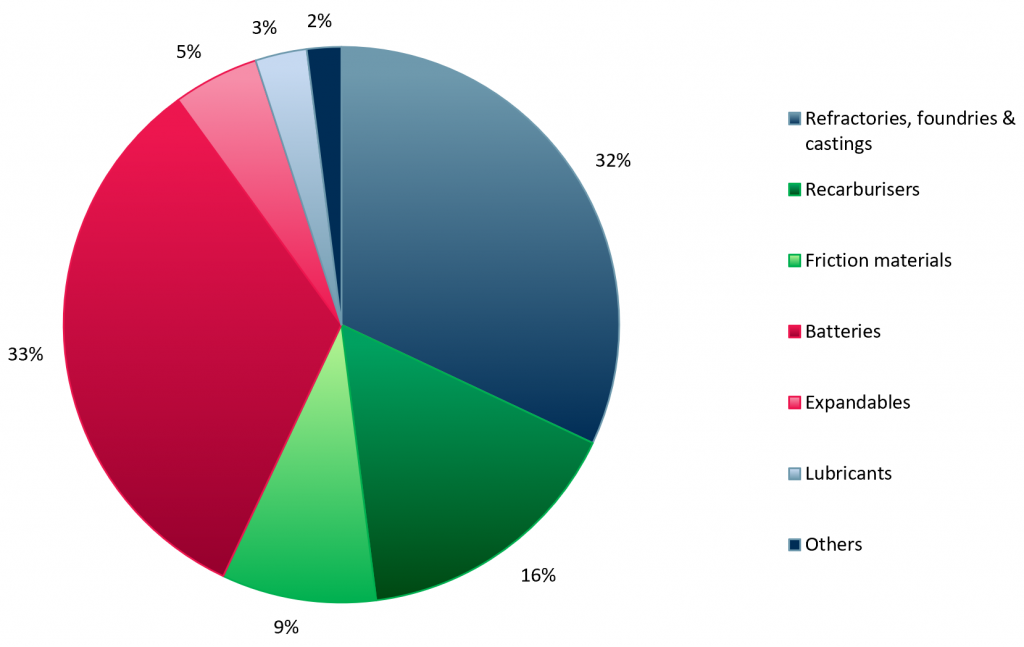
Graphite has a range of applications, of which energy storage (batteries) dominate at 33% in 2022E up from 13% in 2071A (exhibit 1). (The second largest use of graphite is in refractories, foundries and castings at 32% of end usage in 2022E.)
Exhibit 1 – Natural graphite demand by end-user applications 2017A vs 2022E
 |
 |
Sources: ACF Equity Research graphics; FastMarkets.
Could synthetic graphite replace natural graphite and solve supply chain risk in one swoop?
Natural graphite (or graphite) is mined and concentrated, whilst synthetic graphite is formed by graphitising coke or coal tar at 3,000 0C. Synthetic graphite is 2-3x more expensive to produce than natural graphite because it is a more energy intensive process.
Synthetic graphite processes are currently unable to produce graphite that matches the high crystalline structure of purified natural flake graphite. This means that synthetic graphite is less thermally and electrically conductive. Synthetic graphite also does not lend itself to exfoliation and so being made into sheets that are then used in heat sinks, fuel cells and gaskets.
In short, synthetic graphite is currently a lot more expensive, less effective and less useful industrially compared with natural graphite.
Is graphite a sideshow compared with lithium supply concerns in the OEM autos EV market?
Regardless of its form (natural or synthetic graphite), in the anodes of a lithium-ion battery the quantity of graphite used is up to 30x more than that of lithium. For electric vehicles, the amount of graphite used in each EV battery ranges between 50 to 100kg (the Tesla Model S has a lot more graphite in it than the usual upper limit of 70Kgs for an EV).
The answer to de-risking is clearly revealed in the supply and demand schedule – but there is not much time.
According to the Benchmark Mineral Intelligence the demand for natural graphite from the battery segment is forecasted to reach 3m tonnes p.a. by 2030E, up 650% vs. 400k tonnes p.a. in 2021A. (The demand for synthetic graphite is projected to increase to 1.5m tonnes p.a. by 2030E, up 400% vs. 300k tonnes p.a. in 2021E.)
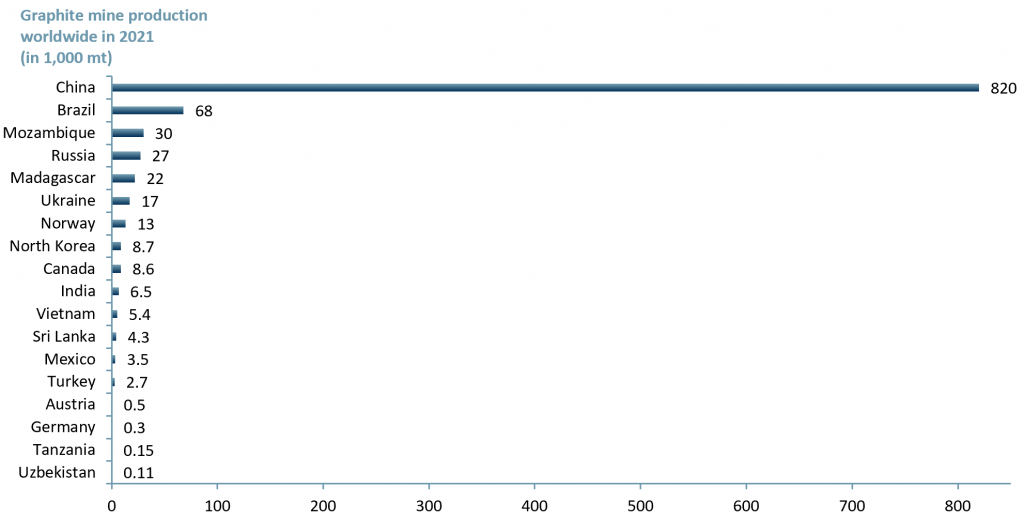
The global production of graphite in 2021E was estimated at 1m MT (exhibit 2) and China is the top producer with 820k MT (~82% of total global output). Notably, the country with the largest graphite reserves (discovered material) is not China, it is Turkey at ~90m MT, which equates to ~28% of total global reserves of 320m MT (note that resources are essentially a best guess, whilst reserves actually exist).
Exhibit 2 – Graphite mine production worldwide by country in 2021E
 Sources: ACF Equity Research Graphics; USGS.
Based on global graphite reserves the countries with the highest potential to produce graphite are Brazil (70m MT), Madagascar (26m MT), Mozambique (25m MT), Tanzania (18m MT) and India (8m MT).
China’s influence in many of these countries (particularly Africa which it sees as its natural resource hinterland) is on the rise from infrastructure provision, to job creation, to political influence. Western governments seem not to have either the wherewithal or the desire to compete. So it is down to companies and their entrepreneurs to de-risk the global supply chain.
It has not been China’s strategy that has woken corporates to the need to act, after all, the Chinese market, though hard to negotiate, has an irresistible commercial draw. It has been the recent supply shocks, which have concentrated the worlds commercial mind on strategic supply lines. Not a moment too soon in our view.
As with all commodities and raw materials, graphite continues to exhibit a supply squeeze that is likely to escalate further due to the ongoing Russia-Ukraine conflict. This is largely due to a lack of new exploration projects, as well as the supply chain disruptions.
After global natural graphite production dropped ~14% to 966k MT in 2020, vs. 1,100 MT in 2019 thanks to the pandemic, a focus on new mining projects and revamping of the supply chain has emerged within the OEM EV autos sector and the exploration and production mining sector. (The drivers are different for OEM autos and miners, but the outcomes are complementary.)
Where Tesla goes so other autos follow. If Tesla’s strategy has the appearance of success then other more vertically integrated miners may find themselves the targets of such supply deals and perhaps outright M&A from other autos and other competing sectors.
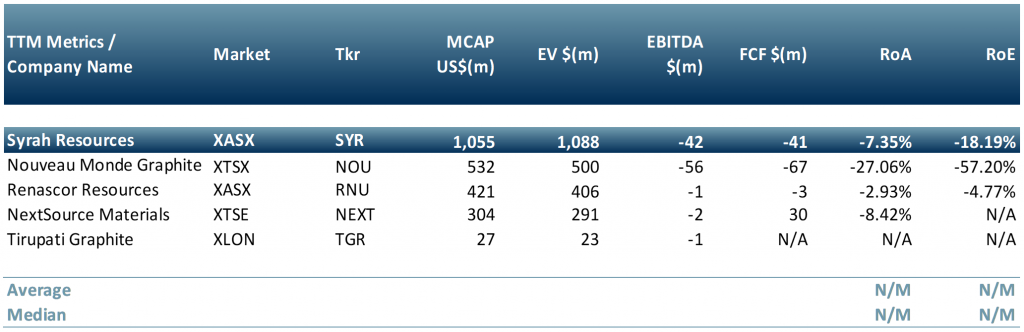
In exhibit 3 below we show a peer group of graphite producing companies: Syrah Resources (ASX:SYR), Nouveau Monde Graphite (TSXV:NOU), Renascor Resources (ASX:RNU), NextSource Materials (TSX:NEXT) and Tirupati Graphite (LSE:TGR).
Exhibit 3 – Peer group of graphite producers normalised to US$
Sources: ACF Equity Research Graphics; Refinitiv; Exchange rate: (Source: XE.com) GBP vs USD 1.1797; AUD vs USD 0.6906.
Authors: Christopher Nicholson and Anda Onu – Christopher is a founding executive, MD and Head of Research at ACF Equity Research. Anda is a member of ACF Equity Research’s Sales & Strategy Team. See their profiles here


