 market")
The biofuels (ethanol) market
Recent data from the biofuels market might suggest structural problems are beginning to appear.
US ethanol exports dropped for a second year in 2020, in large part because Brazil allowed the US’s tariff free export status for ethanol to expire in Dec 20.
- The US is the world’s largest ethanol producer. Annual US fuel ethanol (biofuel) exports fell by 9% in 2020 to 1.3bn gals (US$2.3bn) y/y and are down 20% since the 2018 high of 1.7bn gals exported.
- Approximately 40% of US ethanol production is exported to Canada (25%) and Brazil (15%) – as of 2019 both countries began decreasing their ethanol imports from the US.
- Brazil, the second-largest producer and consumer of fuel ethanol significantly decreased its ethanol imports, dropping to 13k bpd in 2020 (Brazil’s ethanol consumption is high, due to its fuel ethanol blending requirement, currently at 27%).
- Brazil’s ethanol tariff free-quota expired in Dec 20. This means that all US fuel ethanol exports to Brazil now face a 20% Brazilian tariff.
- The uncertainties created in the US ethanol market by the expiration of Brazil’s free-quota tariff; the decrease in fuel demand following the pandemic and the depreciation of the BRD vs. USD (also making US exports more expensive to Brazilians) has significantly eroded Brazil’s status as the top export destination for US biofuel producers.
- Canada is now the top destination for US ethanol exports as of 2020.
“In spite of the uncertainty created for US biofuel exporters by the pandemic, the Brazilian real and the Brazilian tariff changes…opportunities for US exporters remain promising.” ACF Equity Research
Exhibit 1 – Top ethanol exports destinations countries from the US in 2020
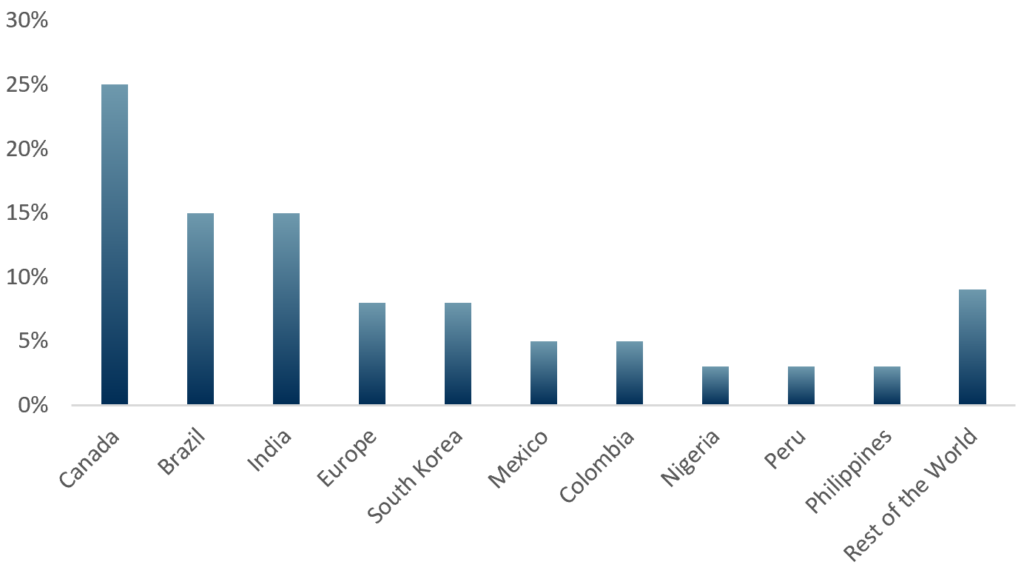
Sources: ACF Equity Research Graphics; US Census Bureau; US Department of Commerce
The future value of the global biofuels market:
Our forecasts suggest the global biofuels market (Ethanol, Biodiesel and Biogas) will grow at an overall CAGR rate of 7.0% for this decade (2020E to 2030E), 2-3x faster than global GDP.
In exhibit 1 below, we forecast the value of the biofuel market using a three-factor growth model.
Biofuels market growth phase 1 CAGR 7.0%:
Our model suggests a phase 1 CAGR of 7.0% for the biofuels sector – governments want to cut emissions and find alternatives to fossil fuels, we conclude they will continue to support the development and growth of the biofuels market.
Biofuels feedstocks – food waste and corn/cane sugar agriculture – currently appear to be less polluting than fossil fuel extraction. In our view, governments will increasingly pursue biofuels as transition fuels.
Fiscal stimulation of the market is relatively straight forward – for example, biodiesel blending proportions can be introduced gradually making for a smooth transition, and much of the underlying infrastructure is essentially in place.
In the new post covid era, we expect a boom in car passenger miles. Our passenger miles growth expectation is driven by several factors:
- Pent-up demand – post-covid pent-up travel demand and a structural drive towards more car use (again assigned to the covid experience) and;
- Fear – leading to lower demand for public or mass transportation systems such as buses, trains, trams and aircraft. Nevertheless, we expect phase 1 growth to be slower than phase 2 growth.
- ESG sentiment – a mixed driver for biofuels
Public and investor sentiment currently supports our assumption that greener fuels will receive an additional demand boost because of the covid experience and increased focus on ESG.
However, the ESG driver will also encourage the use of mass and public transit systems, which in turn also creates potential for cannibalisation of biofuel passenger miles.
Biofuels have potential as ‘easy win’ transition fuels, and in our model we expect net demand to grow leading to higher prices and better returns for biofuels producers / exporters.
There is a popular argument that feedstock costs will increase in a commodity super-cycle to make biofuels uncompetitive. This is only true if feedstock costs accelerate faster than petrol/diesel prices at the pump.
We infer that increases in biofuels feedstock costs in a commodity super-cycle will be move in line with, and be compensated for, by a rising oil price. We expect biofuels producers to be able to charge a commensurate ‘carry’ price.
Biofuels market growth phase 2 CAGR 7.4%:
Lack of infrastructure is often a significant deterrent to investors. In our phase two scenario, we expect further significant biofuels infrastructure investment. For example, pipelines transporting biofuels have specific characteristics. Oil pipelines can be adapted to biofuels, but it takes time and is a competing use of such infrastructure.
Biofuels market growth phase 3 CAGR 6.5%:
Our expected CAGR declines to 6.5% as the market begins to mature, competition rises and governments start to reduce or withdraw fiscal stimulus.
Exhibit 2 – Global biofuel market value estimate from 2020E to 2030E (USD bn)
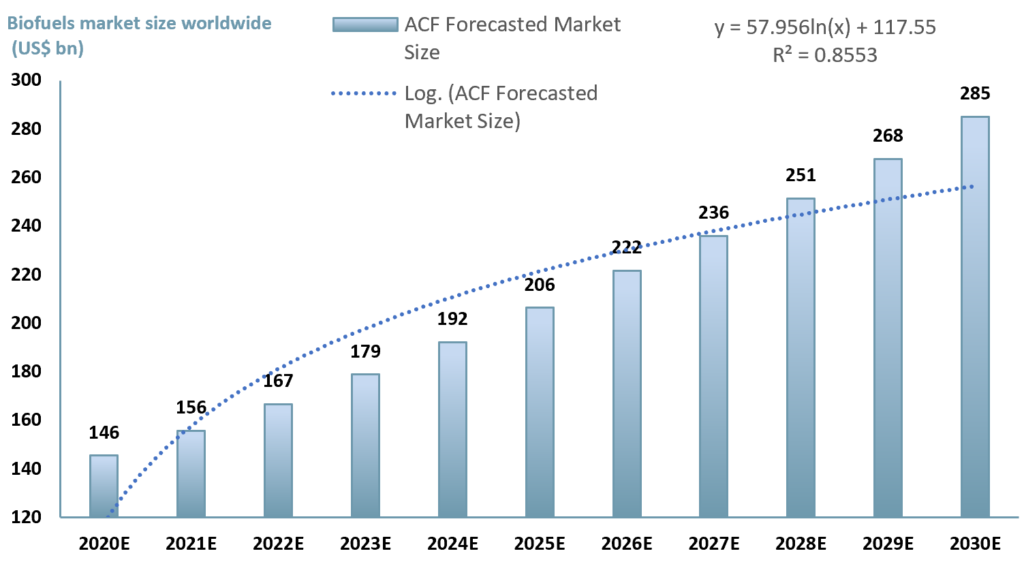 Sources: ACF Equity Research Estimates; Grandviewresearch; Alliedmarketresearch; Globenewswire
Investment exposure
In exhibit 3 below we show one of our biofuels peer groups for investment exposure: Alto Ingredients (Previously Pacific Ethanol) (NASDAQ: $ALTO); Westport Fuel Systems ($WPRT: TSX); Green Plains (NASDAQ: $GPRE); Renewable Energy (NASDAQ: $REGI) and Aemetis (NASDAQ: $AMTX).
Exhibit 3 – Peer group of companies operating in the biofuel industry
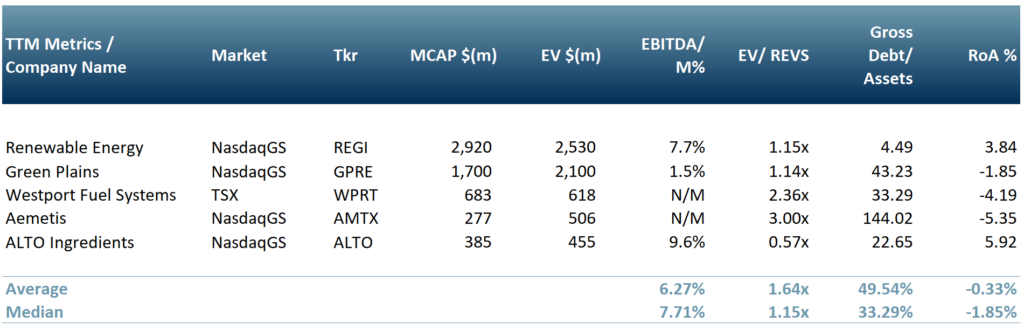 Sources: ACF Equity Research; Refinitiv; Exchange rate: (Source: XE.com) CAD vs USD: 0.8023
Authors: Anne Castagnede and Christopher Nicholson – Anne leads the Sales & Strategy Team at ACF Equity Research, Christopher is head of research and MD. See their profiles here
![Climate change and the [re]emergence of millet](https://acfequityresearch.com/wp-content/uploads/2023/08/ACF_Millet-a-new-sustainable-market-_Twitter-470x320.jpg "Climate change and the [re]emergence of millet")


 market&media=https%3A%2F%2Facfequityresearch.com%2Fwp-content%2Fuploads%2F2021%2F08%2FWe-forecast-increasing-demand-for-biofuels-as-a-%E2%80%98transition-fuel-solution.png)