
The start of a new commodity ‘supercycle’
The prospect of a weak US dollar and an uptick in the inflation rate in 2021 is drawing more investment research attention to the returns that might be available in commodity markets. Is this the start of a new commodity ‘supercycle’ (Kondratiev wave)?
In this analytical blog we make the ACF investment research case for the start of a new commodity supercycle and additionally present possible lithium and PGM peer groups that may benefit from a supercycle.
Our lithium peer group contains Standard Lithium (SLL, TSXV); Lake Resources (LKE, ASX); Bacanora Lithium (BCN, AIM); Savannah Resources (SAV, AiM); Lithium Corp (LTUM, OTCQB). Our PGM peer group contains Eurasia Mining (EUA, AiM(; Norilsk (GMKN, MCX); Impala (IMP, JSE); Northam (NHM, JSE).
Key Points:
- Over the previous decade many commodities had been out of favour with investors and investment research analysts alike but 2020 seems to have been a turning point for raw materials (not just green metals and PGM).
- Strong demand, mostly from China, has driven the price of many commodities to multi-year highs (see exhibit 1).
- The strong rally across such a wide range of commodities – from soybean to tin – is very unusual and hasn’t happened in perhaps 50 years, suggesting we are entering an upturn in commodity demand and pricing best described by the commodity ‘supercycle’ or Kondratiev wave.
- Raw materials are set to benefit further from a rapid vaccine rollout and the ensuing global economic recovery in 2H21E, which we expect to be V-shaped.
- JPMorgan Chase & Co (NYSE:JPM) predicts the start of a new ‘supercycle’ or Kondrative wave similar to that of 2000-2014.
The ‘2000s commodities boom’
The ‘2000s commodities boom’ was a result of increased demand in emerging economies (in particular the BRIC countries – Brazil, Russia, India and China) coupled with concerns over long-term supply availability.
Additional demand was injected by developed economies such as the US, UK, Ireland, Greece and Spain, which were experiencing the ‘mid-2000s housing [and construction] bubble’. Commodities were seen as ‘safe haven’ assets with prices that could be more easily predicted than those of equities.
As markets responded to the 2008-09 financial crisis, commodity prices slumped but quickly recovered towards the end of 2009 and 2010. Nevertheless, prices failed to reach pre-crisis levels and a decade of price decline began and was driven by the following factors:
Commodity prices – the drivers for a decade of contraction
Between 2014 and 2018 many major commodity prices underwent long-run declines. This was due to three overarching factors:
- A strong US dollar: Most commodities are priced and traded in US dollars and so a strong US currency makes purchasing more expensive for foreign investors. The US dollar index recovered to 103 in 2017 after hitting an all-time low of 80 in July of 2011.
- Bullish Equity markets: Equities delivered a superior RoI compared to investing in commodity markets. By 2013, US equity markets had recovered to pre–2008 financial crash levels.
- Low inflation expectations: Commodities are commonly used as a hedge against rising (accelerating) inflation. Between 2011 and 2020, as the global economy recovered from the 2008 financial crisis, inflation expectations declined. Over the 2010-20 decade inflation reached its lowest point in 2015, – US annual inflation dipped as low as 0.12%.)
Short-term commodity price drivers
V-shape cycles – In 2020, Covid-19 caused a V-shaped crash and recovery in equity prices as economies entered lock down, particularly China and Europe. However, 2020 economic data from China showed that its economy was already undergoing a V-shaped recovery. The Caixin China General Manufacturing PMI has been above 50 since May 2020, peaking at 54.9 in Nov 2020.
Short-run supply constraint – Commodity prices responded to China’s return to growth (probably exacerbated by supply constraints after mines around the world had to shut and cease production in response to the pandemic).
Inflation concerns – During the early part of 2021, concerns over inflation rate growth and heavily publicised evidence of commodity supply shortages pushed many commodities prices to decade highs.
Vaccine rollout – In addition, as the pandemic vaccine is rolled out across North America and Europe, manufacturing output will increase and so therefore will raw materials. This demand expansion will support commodity prices, at least in the short-term.
Market psychology (the herd effect) – Other commodities, softs as well as non-green metals and other basic materials will be swept up in the general excitement caused by a broad range of upward prices, at least in the short run, as is the way of markets in a boom. Investors become less discriminating for a period.
Long-term commodity price drivers
Structural supply constraint – Due to the previous decade of low commodity prices, producers did not invest in expanding mining capacity. It made more economic sense for mining companies to leave their assets in the ground and try and keep supply tighter to push prices up. Covid-19 created a supply shock crystallising the shortfall in supply compared with demand.
Renewable energy transition – We expect long term commodity price support will come from the demand for green metals from the global renewable energy transition. This transition, though much accelerated as a result of the pandemic, is still probably a 2-4 decade cycle.
Policy support – There are 191 UNFCCC members (‘countries’) out of 197 or 97% that are signatories to the Paris Climate Agreement. Of the major carbon emitters only Iran, Iraq and Turkey have not signed as of February 2021. The Paris agreement adds to the demand equation by supporting the transition to a renewable energy global economy.
Publicity – The pandemic, the general awareness of the overwhelming need for green metals for energy transition and the Paris Agreement lend further support to our ACF investment research case that there will be a prolonged period of price growth for many commodities.
Exhibit 1 presents the price response of a mixed bag of commodities to the drivers from 2015 to early 2021.
Exhibit 1 – Prices of platinum, tin, copper, soybean, corn US$/mt 2015, 2020, 2021
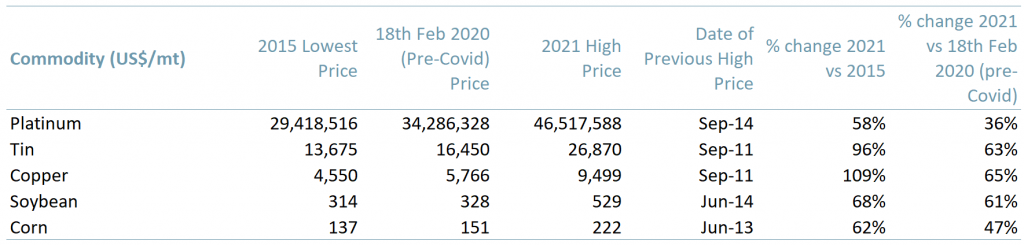 Sources: ACF Equity Research Graphics; Investing.com
Note: Here the units are in US dollars per mt (referring to a metric ton or 1000kg)
Exhibit 2 is a price relative chart comparing tin, copper, corn, soybean, platinum, iron and WTI crude oil between 2 Jan 2020 and 15 Mar 2021.
Since pre-Covid-19 (18/02/2020) iron, copper and tin have delivered the strongest investment performance. Iron copper and tin have increased in price 95%, 65% and 63% respectively. In addition, copper at US$ 9,499/t and tin at US$ 26,870/t are at approximately 10-year highs (highest prices since Sep 2011).
Iron has increased to US$ 168.26/t on 15 Mar 2021, up US$ 82.11/t or 95% vs US$ 86.15/t on 18 Feb 2020 (pre-Covid).
Crude oil is also back above its pre-pandemic price with WTI crude reaching US$ 65.39/bbl on 15 Mar 2021, up US$ 12.1/bbl or 23% vs US$ 53.29/t on 18 Feb 2020 (pre-Covid).
Exhibit 2 – Price relative chart of tin, copper, corn, soybean, platinum, iron and WTI oil 2 Jan 2020 – 15 Mar 2021
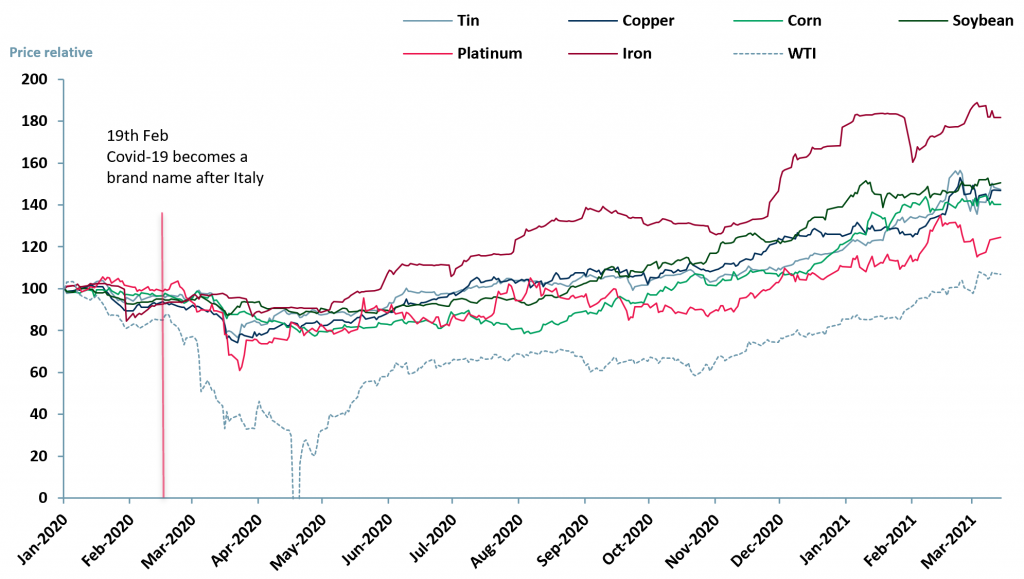 Sources: ACF Equity Research Graphics; Investing.com
The trend illustrated by ACF in Exhibit 2 above is broadly mirrored by the price changes of other commodities:
It is the coalescence of short and long run drivers and the dramatic moves in prices across the board that has lead ACF, and is leading other investment research analysts and thus the markets, to conclude we are entering a commodity supercycle.
Supercycle theory supports ACF’s investment research conclusions
In economic theory, supercycles (also referred to as Kondratiev waves, named after Nikolai Kandratiev who first hypothesised the idea) are theoretical cycles of high sectoral growth followed by periods of slow growth. The traditional theory suggests that a cycle will last between 45-60 years.
A modern adaptation of the Kondratiev wave theory, developed by Daniel Smihula, suggests that each cycle becomes shorter than its predecessor due to technological innovation. The previous supercycle, ended with the 2008 financial market crash.
If Simihula’s adaptation is correct and supercycles are becoming shorter, this could support a hypothesis that after 15 years the commodities sector is due a new period of expansion.
Simihula’s research is supportive of ACF’s own independent investment research conclusions, which infer that both market and real economy cycles are contracting over time and that we shall henceforth always experience market and real economy contractions and recoveries as a V-shape.
Exhibit 3 – Potential Lithium plays / peers (battery metals)
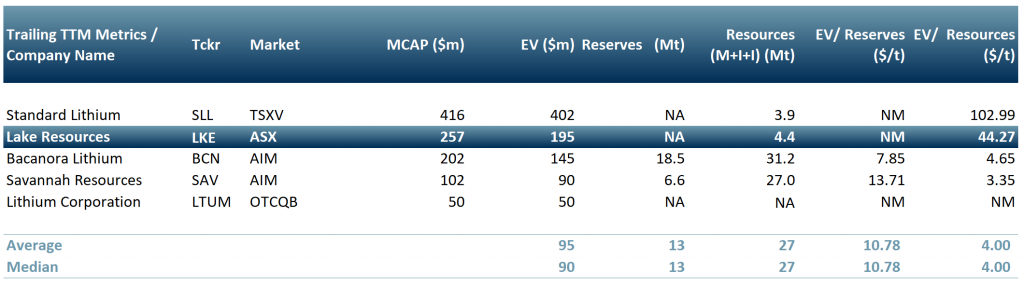 Souce: ACF Equity Research
Exhibit 4 – PGM peers / plays (autocatalytics / green energy and other industrial uses)
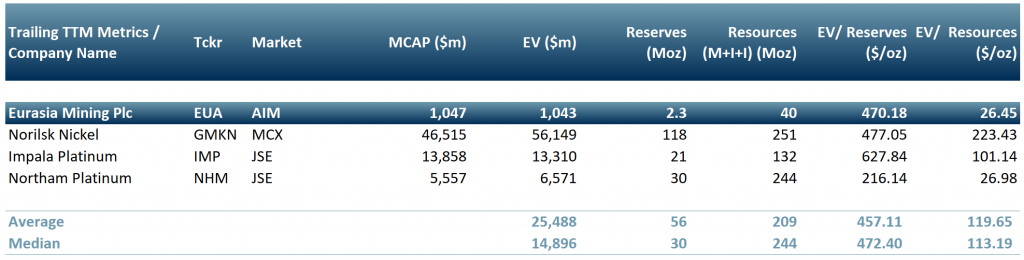 Souce: ACF Equity Research
Authors: Christopher Nicholson, Renas Sidahmed and Sam Butcher – Christopher is ACF’s MD and Head of Research, Renas is an ACF Staff Analyst and part of the Sales & Strategy team, Sam is an ACF Junior Staff Analyst. See their profiles here


