
Three Key Trends in Renewables that Make Fossil Fuel Investing Trickier – A Global Outlook
Climate change has long superseded nuclear pollution as the key driver keeping renewable energy on the global agenda. Solar renewable energy has arguably been the greatest beneficiary of the climate change driver and remains the fastest growing source of renewable global electricity generation.
The consensus expectation is that solar will increase from about 2% of the global energy mix today to 22% by 2050. These growth forecasts suggest that solar will remain an attractive investment for the foreseeable future.
The market for solar energy generation is dominated by two technologies – ‘Thermal’ and ‘PV solar power’. Thermal energy for water heating is a fairly old technology with global capacity reaching well over 400 GW, perhaps the equivalent total energy demand of 25m US homes. Thermal energy technologies are also used in tandem with photovoltaic (PV) solar energy technologies to create hybrid solutions in solar heating and cooling.
The generation of solar electricity involves a direct and indirect approach. The direct approach utilises PV technology to convert radiation directly to electricity while the indirect approach involves using mirrors/lenses to focus sunlight to heat water to produce electricity (Malinowski et al., 2017).
Part of the underlying framework that supports or drives solar energy demand is the supranational Paris Agreement of 2015, which set net zero emission targets by 2050 for 15 countries. Solar is expected to have a significant role in realising this agreement goal.
There is a general upsurge in global renewable energy demand underpinned by national government policies around the globe focussed on renewable energy and technological innovation. Solar is the major beneficiary of this growth in demand and policy drive.
Technological innovation has gradually reduced the cost of solar energy production making it a favourable competitor in the provision of clean energy when comparing the cost using barrel of oil equivalents (BOE) comparisons. When considering the potential investment returns within the solar industry, it is worth considering some of the recent trends in the industry. We outline the trends we consider most important below.
Trend #1 – Reduction in costs of solar energy production
Solar PV technology has exhibited a 99% decrease in costs over the past four decades. This fall in costs has helped drive the growth in demand for solar powered energy and enhanced its ability to compete with fossil fuels.
The International Renewable Energy Agency (IRENA, 2019) projects that Solar PV will consistently offer a cheaper source of energy than the cheapest fossil-fuel alternative – coal – by the end of 2020 disregarding any financial subsidies. Other sources suggest that cost parity will occur by 2030 for all renewables.
The so-called overnight cost (capital cost) to produce 1KW from a gas/oil combined cycle power plant is around $1,000 at 2019 prices, for solar this cost was $1,060 to $1,800 for fixed PV and $1,130 to $2,000 for tracking PV. Other renewables were still a long way off from gas/oil combined capital costs per KW at 2019 prices.
The global average cost of developing a new solar photovoltaic (PV) plant in 2018 is cited at $0.10/kWh compared to plants based on fossil fuels like oil and gas that ranged from $0.05/kWh to over US$ 0.15/kWh. Solar costs in 2020 are probably around US$ 0.08 to US$ 0.24 KWh. The trend is clear, solar costs are falling thanks to innovation vs. the rather static state of oil and gas power generation.
In addition, data has shown that over the past years, record low auction prices of USD 0.03/kWh are attainable for solar PV in Dubai, Mexico, Peru, Chile, Abu Dhabi and Saudi Arabia; though this of course is caused by disequilibrium in the supply and demand curves, that may not be related directly to underlying solar generation costs.
The rapidly falling costs of solar power generation without the need for subsidies has made it a viable alternative source of electricity supply for conventional energy grids. Not only does solar come with minimal environmental impact, it is also reaching ‘grid parity’ with fossil fuels. Grid parity is the point at which the Levelised Cost of Electricity (LCOE) of a specific generator meets the wholesale market price for electricity in that country (BayWa-r.e, 2019). Grid parity varies between countries.
The continued fall in capital expenditures (capex) and the move towards grid parity as measured by the LCOE in the renewable energy sector describes a trend that suggests all renewables will eventually reach grid parity. Solar is arguably already at capex parity or better compared to fossil fuels, before attempting to assign value to the currently qualitative character of its low environmental impact.
Quantifying the real financial advantage of minimal environmental impact is somewhat more difficult to assess at present because of it is a complex issue, and because of what economists refer to as the ‘free rider’ and ‘polluter pays’ problems. Nevertheless, the perception of the environmental impact comparison may lead to greater legislation that would translate to a demand from entities running grids and their investors for solar electricity and heating because it delivers a better risk vs. return on investment profile.
Exhibit 1: Comparison of the CAPEX split for a PV installation 2010-2021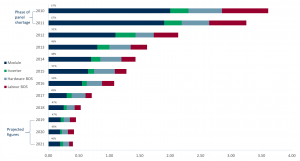
Source: ACF Equity Research Graphics; Data from BayWa-r.e. 2019
The chart above shows that all elements of the cost capex costs of solar have contracted sharply but that the fall in costs of the PV modules has been by far the most significant driver to falling PV installation costs.
Trend #2 – Innovation in construction of solar cells
Laboratory testing of solar cells has indicated that the best performing commercial cells, monocrystalline silicon cells, operate at about 25.6% efficiency (these single-junction panels have a maximum theoretical efficiency of 33.16%).
PV technology multi-junction solar cells, a newish innovation, use a combination of semiconductor materials, which allows for a broad range of wavelength absorbance (this contrasts with single-junction monocrystalline silicon cells). Multi-junction PV could improve the efficiency of solar power capture. Research into combining several semiconductor materials in PV has achieved results of up to 46% efficiency (if an infinite number of junctions was used, the limiting efficiency is 86.8%).
However, the current price-to-performance ratio of multi-junction PV has limited its use to specialist niches such as the aerospace industry and space exploration, where the high power-to-weight ratio is more important (Malinowski et al., 2017). It seems to us that the current cost for multi-junction PV will fall so long as it continues to attract investment from the aerospace and space sectors, which in time will attract a wider group of investors and so accelerate the rate of innovation.
Trend #3 – Fossil fuels peak demand
Fossil fuel assets under the ground are valued somewhere between USD 70 and 80 trillion with demand for fossil fuels expected to peak by 2030. Fossil fuel demand is likely to reach a peak in the face of continued global energy demand growth because trends #1 and #2 will create investment opportunities for renewable energy across many, if not all, sectors but particularly in utilities, transport, energy and agriculture.
In addition, the capex and LCOE data above and the infrastructure and operational nature of solar suggest that Solar PV is the most suitable option to provide energy to rural areas. In sub-Saharan Africa and most of the emerging world the alternative, electrical grid extension, is not currently or foreseeably economically viable.
What is left of the investment opportunity?
The long run investment opportunity appears to be intact. We provide a selection of ETF price relative charts below showing the 12-month performance of specialist renewable ETFs vs. the FTSE 100 and S&P 500 respectively.
The five ETFs we have chosen are index/passive or tilt specialist investment funds in renewable energy.
● Invesco Solar ETF (TAN) is a Solar ETF with AUM of approximately USD 560m;
● First Trust Global Wind Energy ETF (FAN) is a wind energy ETF with AUM of approximately USD 95m;
● iShares Global Clean Energy ETF (ICLN) mixed renewables with AUM of approximately USD 630m;
● First Trust NASDAQ Clean Edge Green Energy Index Fund (QCLN) renewable energy tech fund with AUM of approximately USD 195m and;
● Global X YieldCo and Renewable Energy Income ETF (YLCO) renewable energy utility spin-offs with AUM of approximately USD 50m.
Source: ACF Equity Research graphics and analysis, data source Yahoo Finance (2020)
The charts above show that the five renewables ETFs we considered have performed either in line with the S&P 500 and the FTSE 100 or have outperformed these indices over the last 12 months. We suspect that record will continue over the next 12 months in spite of an indicative Covid crisis 10% cut in renewable energy capex and the current delays to project completion and approval flagged by the sector due to the coronavirus pandemic.
Fortune Business Insights (2019) estimated that the global solar industry generated 680.22 GW in 2019 and projected a CAGR of 30.7% through to 2026. Similar research carried out by Allied Market Research (2019) valued the industry at USD 52.5 billion in 2018 and estimated a CAGR of 20.5% and a projected value of USD 223.3 billion by 2026. We argue that these CAGRs will only accelerate as a result of the Covid crisis. The industry may make a 10-year leap in the next 12 months alone.
Guest Blogger: Timothy Kigozi
I am an entrepreneur and investment consultant with a great understanding of the East African investment terrain. In my free time I help start-ups get off the ground through mentorship and connection to investment channels.


