
Clean energy displaces oil majors
The global pandemic has increased investors’ transition from big oil to green energy. Clean energy companies are outperforming oil majors by returns and displacing them by valuation.
- NextEra Energy (NEE: NYQ) generates and distributes energy in the US using wind, solar, nuclear coal and natural gas. NextEra’s stated goal is to focus on renewable generation.
- NextEra exceeded ExxonMobil’s (XOM: NYQ) market value on the 2nd Oct 2020 – US$ 138.6bn vs. US$ 137.9bn respectively – on an uncertain outlook for oil and bets on a changing energy system.
- NextEra Energy, a company with less than 15k employees, has experienced a threefold increase in energy demand compared to 2018A.
- ExxonMobil, with ~74k workers, was removed from Dow Jones Industrial Average on the 24thAugust 2020. Its MCap on 02/10/20 of US$ 137.9bn reflected a 50% decrease from ~US$ 276bn at the start of 2020.
- NextEra Energy has a pilot programme that produces hydrogen using solar electricity. Hydrogen is expected, at least in some quarters, to become the fuel replacement for diesel.
- NextEra also predicts that the prices for wind energy consumers will drop to $20-$30 MWh in 2050 from $28–$54 (MWh) in 2020. We think it will be faster, driven largely by Chinese production volumes and possibly even Chinese innovation.
The recent renewed intense interest in hydrogen as a source of fuel suggests it could become mainstream. Consider aviation for example in the future of aviation. While Hydrogen is currently relatively costly to produce, it can be produced from renewables in the form of ‘green hydrogen’.
Grounded aircraft and lockdowns – 2020 accelerated and sharpened the shift in popular attitudes towards environmental damage. As a result politicians have developed an increased focus on transitioning their economies to carbon neutral in an attempt to deliver the public what they want by either stopping or reversing climate change and environmental degradation.
The lockdown of global economies – the closing of factories and the minimisation of transportation had unprecedented positive impacts on the environment.
There was a significant difference in air quality with CO2 and CO emissions dropping in major cities. In Barcelona, Madrid, Milan, Paris and Rome NO2 (nitrogen dioxide) emissions fell to 30%, down from 60%.
At the beginning of the pandemic, we forecasted that the renewable energy sector would be among the top performing industries alongside healthcare, technology and telecommunications.
Our insight was confirmed by a study from the International Energy Agency (IEA) and Imperial College London. The study indicated that US renewable power stocks rose 2.2% between March and June 2020, while fossil fuel stocks plunged by more than 40%, that’s a 42% out-performance by renewable power vs. carbon power. (Over the past 10 years, US renewable power stocks rose by > 200% – more than 2x that of fossil fuel stocks.)
The UK, France and Germany showed similar trends. In France and Germany fossil fuel returns fell by 25% over the same period (March to June 2020), while renewable returns rose by 171%.
In addition, in September 2020 the iShares Global Clean Energy ETF (ICLN) outperformed the broader market, posting a return of 47.4% vs. the Russell 1000’s 12.6% over the past 12 months.
In exhibit 1 below, we show ACF’s peer group of the largest companies by market cap that are working mainly within or have a stated and actionable key focus on the renewables sector – NextEra Energy (NYSE:NEE), Iberdrola S.A. (IBE:MC), Orsted A/S (ORSTED:CO), Vestas Wind Systems A/S (VWS:XETRA) and Sie mens Gamesa Renewable Energy (SGRE:MC).
Exhibit 1 – Peer group of top five renewable energy companies
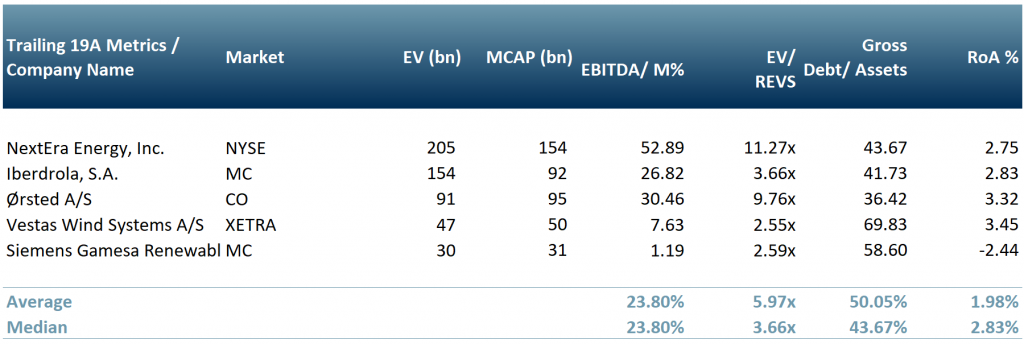 Source: ACF Equity Research
Clean energy companies are not only outperforming oil majors, they are also outperforming major indices (see exhibit 2 below). VWS, SGRE and ORSTED have outperformed all three indices (S&P, NASDAQ and DJI, while NEE and IBE have outperformed the S&P and DJI.
The outperformance difference is increasing and has been enhanced during the crisis and rebound periods.
Exhibit 2 – 12 months price chart of top five companies vs. major US indices
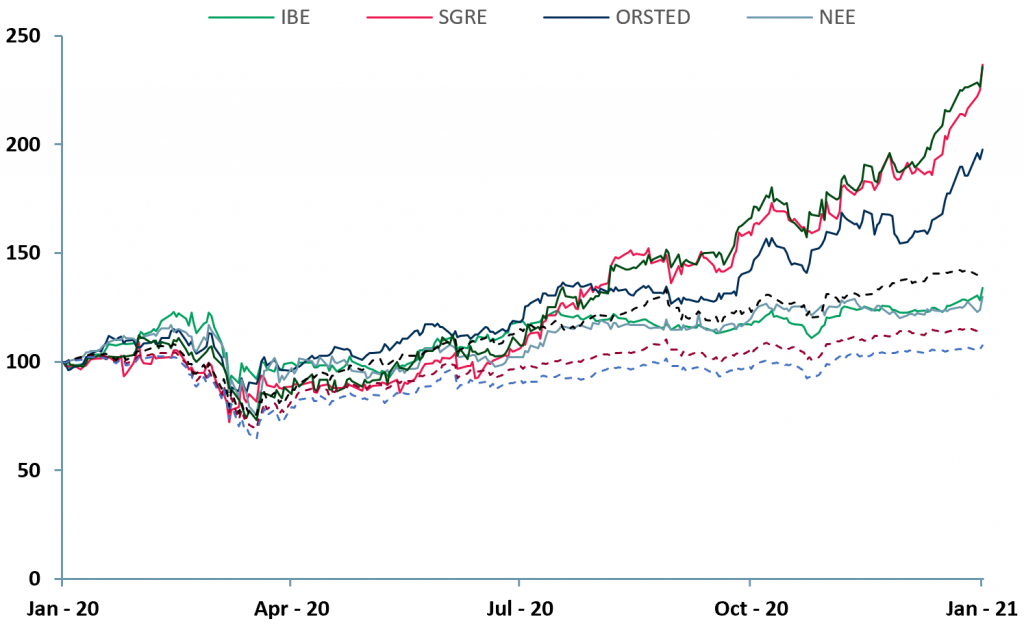 Source: ACF Equity Research Graphics.
Given the resilience of the renewable sector as showcased above, we forecast that the market will reach US$ 2.23trn by 2030E, up from US$ 1.12trn in 2020E at CAGR of 8.00% (Exhibit 3 below).
Our slightly higher than consensus growth rate reflects the overarching global agenda of the Paris Agreement; the return of the US to the green energy table; public support for green energy and the ensuing political commitment that comes with this and; the increasing trend in sustainable investing as represented by AUM that required investee companies to have sustainability policies.
Exhibit 3 – Estimated global renewable energy market size 2020E – 2030E
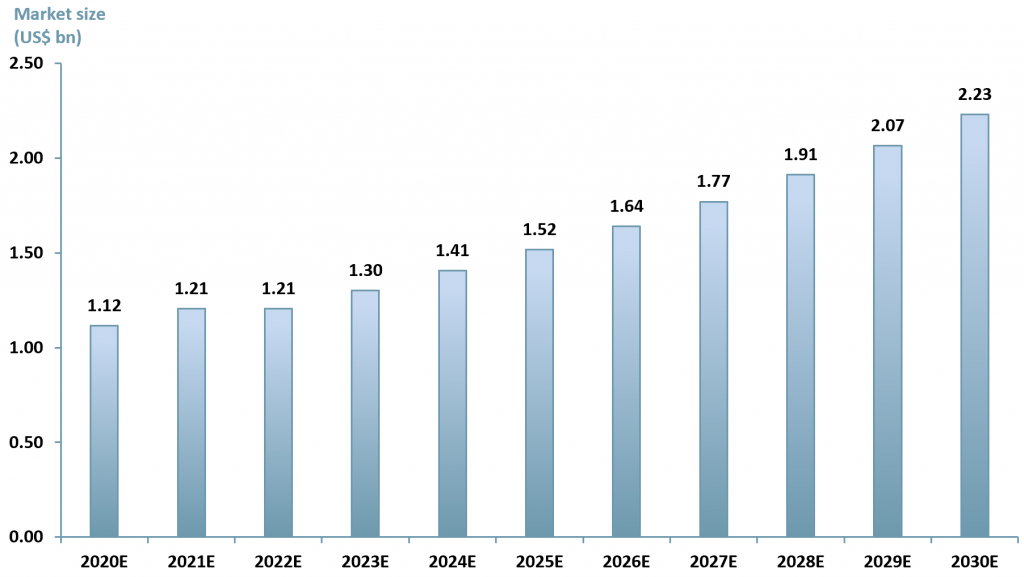 Sources: ACF Equity Research; AlliedMarkets; MarketResearchFuture.
The trend we describe in the renewables sector in exhibit 3 above is only expected to increase in momentum. In particular, the new wave of millennial investors are prioritising sustainability when making decisions about potential investment opportunities – this is true of millennials all the way through the investing spectrum from professional portfolio managers or relatively unsophisticated retail investors.


