
Prospects for global iron ore supply growth and prices
Fortescue Metals Group (ASX:FMG, MCAP ~AUD 46bn), reported record annual iron ore shipments for FY20-21. FMG’s performance was driven by iron ore demand boosted by China’s economic recovery.
Fortescue’s shipments reached 182.2m tonnes (mt) of iron ore for this fiscal year. This led to net profits of over 117% (~ US$ 10.3bn) and US$ 8bn in dividends.
- Alongside Fortescue, an Australian miner, peers such as BHP Group ($BHP.L: LSE) and Rio Tinto Group ($RIO.L: LSE) also recorded major profits and US$ billions in dividend pay-outs.
- Iron ore prices experienced a major surge in May 2021 reaching US$ 230 per tonne. This is mainly due to Chinese soaring demand in steelmaking (▲ >11.8% in 1H21).
Large and mega-cap miners have probably never before generated such high levels of free cash flow. We assess that there are four factors at play, commodity super-cycle driving prices higher, a decade of cost cutting after 2008, investment in tech and increasingly, ESG internal disciplines.
Iron Ore – a brief introduction to usages
There are four main types of iron ore deposit: massive hematite (Fe2O3), which is the most mined, magnetite (Fe3O4), titanomagnetite (Fe2(Fe3,Ti)2O4), and pisolitic ironstone. (BHP, 2021)
Iron is responsible for the red colour in many of our rocks, the deep red sands of the Australian deserts and is the key ingredient in steelmaking. It takes around 1.6 tonnes (mt) of iron ore to produce one tonne (mt) of steel. (BHP, 2021)
Over 95% of iron ore extracted is used in steelmaking. The remaining applications include:
- powder iron (magnets, auto parts and catalysts);
- radioactive iron (medicine and metallurgical research);
- Iron blue (pigment in paints, cosmetics, fertiliser) and;
- black iron oxide – metallurgy, medicine, magnetic inks, and ferrites for the electronics industry – as cathodes and anodes for Li-ion batteries (Natural resources CA, 2020).
As of 2020, the top geographical producers of iron ore are Australia (900m mt), Brazil (400m mt), China (340m mt), India (230m mt) and Russia (95m mt). Australia accounts for around 25% or global iron ore supply.
Long run iron ore price drivers
Iron ore use and demand is entering a new era that is about to unfold. Part of our expected surge in iron ore demand is a factor of population growth and the subsequent demand for homes – part of the old demand schedule element.
The new elements we expect in the iron ore demand schedule are underpinned by climate change-imposed actions like the transition to electric vehicle (EV) transportation.
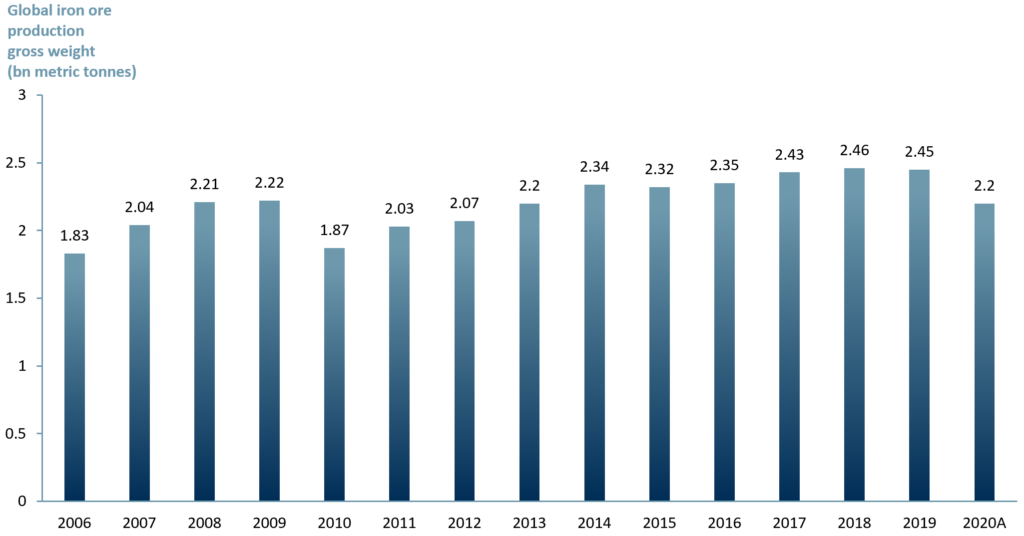
In the past 15 years, the highest iron ore production registered was in the period 2017-2019. The peak output growth was in 2018 with 2.46bn metric tonnes produced worldwide, as shown in exhibit 1 below.
Exhibit 1 – Historical iron ore production gross weight worldwide between 2006A-2020A
 Sources: ACF Equity Research, USGS, GlobalData
Short run iron ore price drivers
As expected, the C-19 pandemic took a toll on iron ore mining. The imposed restrictions and lockdowns in 2020 are reflected in the ~3% drop in production vs the 2019 output.
Despite this drop in 2020, iron ore production from Australia was relatively unaffected by Covid-19 due to effective measures adopted by the Australian government.” Additionally, China’s fast recovery “led to a significant 10.4% increase in its iron ore output.” (NS Energy Business, 2021)
Although the mines are able to produce, the supply chain to get the ore and its products to market is still suffering disruptions suffered by ports and factory closures as a result of structural changes, particularly in Asia, triggered by the various C-19 pandemic waves.
ACF expects the pandemic effects to continue at least until the end of 2022. In the meantime, due to spikes in infections worldwide, predominantly in Asia, the iron ore shortage caused by logistical challenges (and mine closures) will persist.
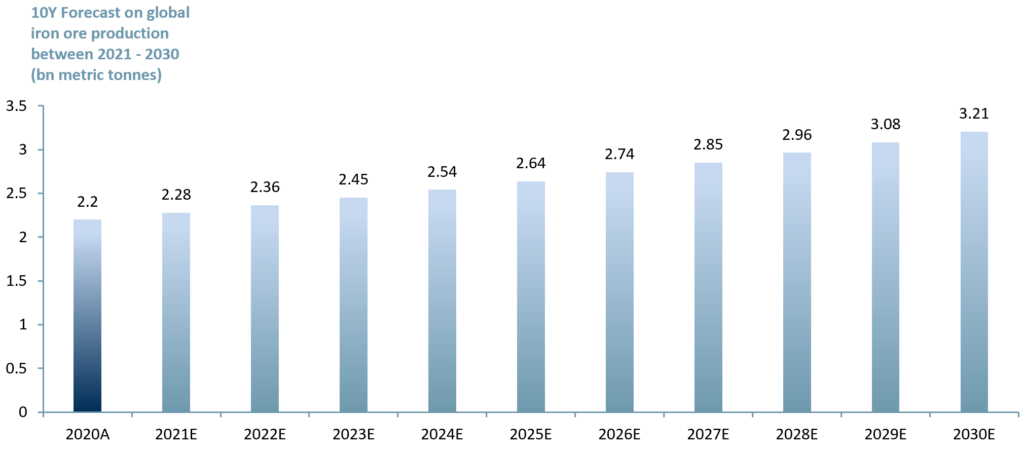
So, although we forecast that iron ore production (supply) will continue to grow in response to demand drivers in our 3-phase model, we expect the 10-yr CAGR to be just 3.8%, reaching 3.2bn metric tonnes by 2030.
Besides the construction industry, new demand drivers beyond 2025 will come from the automotive sector (from iron based EV batteries) and steel used for the accelerated replacement of the global vehicle fleet.
We are of the view that the drive to replace fossil fuels will lead to an accelerated vehicle replacement cycle over this decade, in favour of hybrid electrical vehicles (HEV) and electric vehicles (EV).
Exhibit 2 – 10 y forecast on iron ore production 2021E to 2030E
 Sources: ACF Equity Research, USGS, GlobalData
Changing nature of iron ore mining
The inevitable transition to green vehicles and green energy will occur in conjunction with miners not only moving to green production techniques but also talking far more about such actions. Australia’s Fortescue has already established its green energy and renewables branch called Fortescue Future Industries.
A peer selection of iron ore investment beneficiaries?
Our peer group in exhibit 3 below highlights a mixture of mining companies bound together by our view that they will benefit from the greening of the global economy.
Note that the peer group below is by no means an exhaustive list, but it provides a range of MCAP companies that we believe are either exhibiting change or are in a position that could lead to significant re-ratings if our future of iron view materialises.
Exhibit 3 – Peer group of iron ore producers as of 2nd of Sept 2021
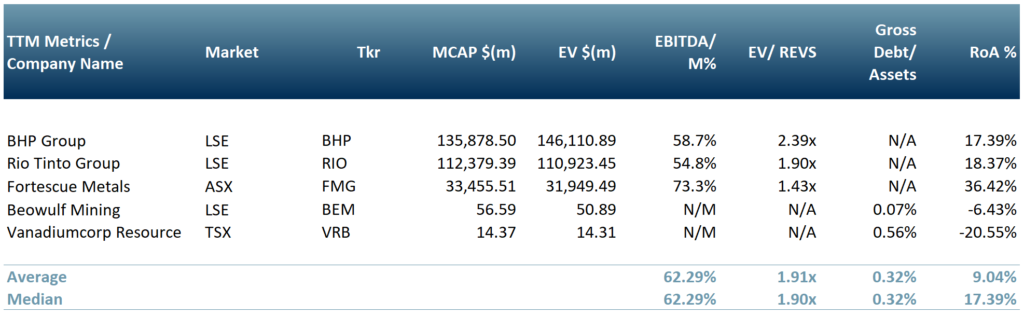 Source: ACF Equity Research Graphic; Notes: Currency translation xe.com; CAD vs. USD: 0.7939; GBP vs. USD: 1.3811; AUD vs. USD: 0.7400


